3:30 p.m. New York time
Half an hour before the closing bell. The S&P 500 declined during the session, with the futures remaining more than 50 points above yesterday’s low, and then rose again, remaining below the overnight high. Wave 4{-9}, an upward correction, as been underway since yesterday, and the wave pattern is consistent with an A wave within wave 4{-9}. No change in the analysis. I’ve updated the chart.
11:10 a.m. New York time
BA earnings play entry. I’ve entered a short bear call options spread on BA, whose earnings will be announced Wednesday, January 26, before the opening bell. I’ve posted an analysis of the trade.
10:50 a.m. New York time
GE earnings play exit. I exited my short bear call options spread on GE the day after entering for a 74.4% profit, as shares fell sharply after earnings were announced. I’ve updated the analysis with details of the exit.
9:35 a.m. New York time
What’s happening now? The S&P 500 E-mini futures rose in overnight trading, retracing 38.2% of the decline from January 12.
What does it mean? An upward correction of that decline is now underway. The 38.2% retracement is a Fibonacci level, a not uncommon turning point within corrections. I expect this correction to remain below 4572.75. More on that expectation in the Elliott wave section, below.
What are the alternatives? Alternative #1: The upward movement that began on January 24 is a lower level correction within the downtrend, rather than a correction at the level of the downtrend. That sounds obscure, but it’s not. A higher level correction will move higher and take more time to complete than will a lower level correction.
Alternative #2: The downward movement that began on January 4 is a correction within an ongoing uptrend. A move above 4572.75 will increase the odds of this scenario being correction, and a rise above 4808.25 will confirm it.
The chart. I’ve drawn a grid showing the Fibonacci retracement levels over the price chart, in red. See this Investopedia entry on Fibonacci levels for an explanation of what they are and how they relate to prices.
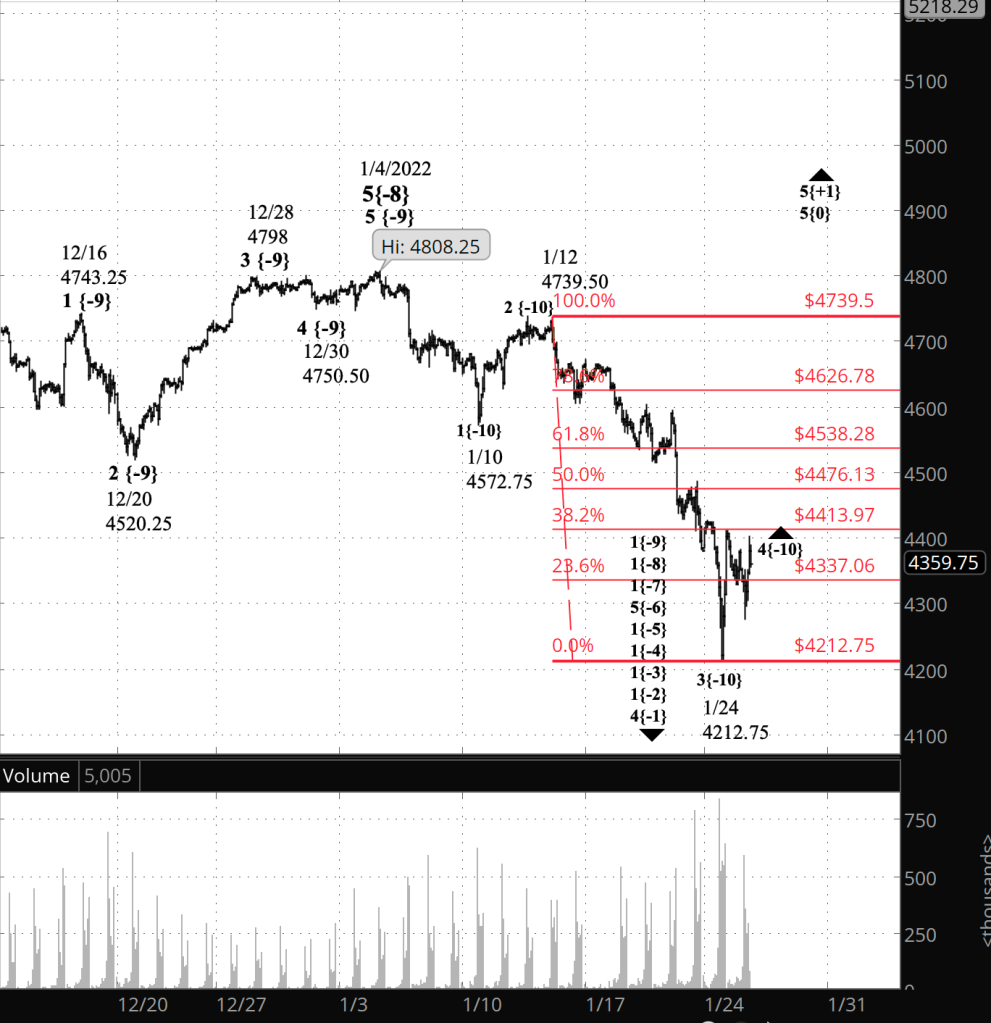
What does Elliott wave theory say? Under my principal analysis, wave 3{-10} within wave 1{-9} ended on January 24, at 4512.75, and the present rise is the early stage of wave 4{-10}. All of this is happening within wave 1{-8} a larger downtrend that began on January 4, the end of wave 5{-8} at 4808.25. Under the rules of Elliott wave analysis, 4th waves never move beyond the end of the preceding wave 1, which in this case ended on January 10 at 4572.75, slightly above the 61.8% retracement level. Given the tendency of corrections to fit within the structure of Fibonacci retracement levels, an upside target of 4538 — the 61.8% retracement — would be a reasonable expectation for the 4th wave’s ending point.
Fourth wave corrections tend to be of the Flat pattern, although not always. If this one is a Flat, then the A wave will have three subwaves, as will the B wave, and the C wave will have five subwaves.
Alternative #1 sees the present rise as an upward correction, but at a level below degree {-10}. A quick reversal to prices below 4512.75. would confirm this scenario.
Alternative #2 sees the January 24 low as the end of a correction within an ongoing uptrend, wave 5{-8}. A move above the January 4 high, 4808.25, would confirm this scenario.
Learning and other resources. Elliott wave analysis provides context, not prophecy. As the 20th century semanticist Alfred Korzybski put it this way in his book Science and Sanity (1933), “The map is not the territory … The only usefulness of a map depends on similarity of structure between the empirical world and the map.” And I would add, in the ever-changing markets, we can judge that similarity of structure only after the fact.
See the menu page Analytical Methods for a rundown on where to go for information on Elliott wave analysis.
By Tim Bovee, Portland, Oregon, January 25, 2022
Disclaimer
Tim Bovee, Private Trader tracks the analysis and trades of a private trader for his own accounts. Nothing in this blog constitutes a recommendation to buy or sell stocks, options or any other financial instrument. The only purpose of this blog is to provide education and entertainment.
No trader is ever 100 percent successful in his or her trades. Trading in the stock and option markets is risky and uncertain. Each trader must make trading decisions for his or her own account, and take responsibility for the consequences.
License
All content on Tim Bovee, Private Trader by Timothy K. Bovee is licensed under a Creative Commons Attribution-ShareAlike 4.0 International License.
Based on a work at www.timbovee.com.

You must be logged in to post a comment.