3:30 p.m. New York time
Half an hour before the closing bell. The S&P 500 futures spent much of the day at or below the 23.6% Fibonacci retracement level. Wave C{-11} within an upward correction, wave 4{-10} appears to still be underway. However, the first alternative — wave B{-11} is still underway — deserves consideration as long as the price is stalled well below the January 26 peak, 4446.25. No change in the analysis. I’ve updated the chart.
2:15 p.m. New York time
Earnings play entry, AAPL. I’ve entered a bull put options spread on AAPL, timed to coincide with the company’s earnings announcement after the closing bell today and have posted an analysis of the trade.
9:35 a.m. New York time
What’s happening now? The S&P 500 E-mini futures fell to 4263.25, 50 points above the January 24 low, and then reversed, rising more than 100 points.
What does it mean? The upward correction that began on January 24 continues. The overnight low was the middle leg of the correction, a retracement to the downside, and the subsequent rise is the final leg of the correction.
What are the alternatives? There are two:
Alternative #1: Yesterday’s high, 4446.25, marked the end of the upward correction, the subsequent decline is a resumption of the downtrend and the overnight rise is a low-level correction within the downtrend.
Alternative #2: The overnight rise is a continuation of the middle leg of the correction.
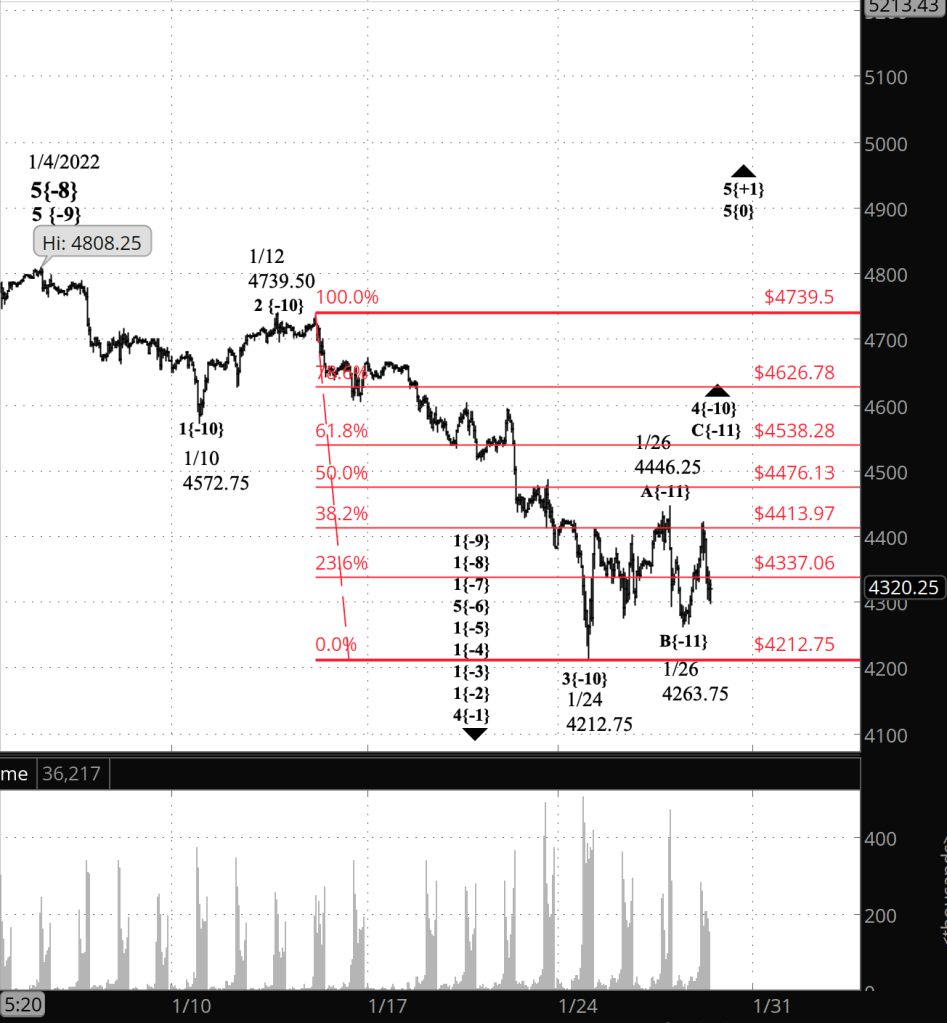
What does Elliott wave theory say? The upward correction that began on January 24 is wave 4{-10} — on that both the principal analysis and the alternatives agree. The disagreement is about the waves within that wave.
Principal analysis: Wave B{-11} ended with the overnight low and the subsequent rise is wave C{-11}, the final wave within wave 4{-10}, unless it forms a compound structure, a not uncommon occurrence in 4th waves.
Alternative #1: Wave 4{-10} ended with yesterday’s high, the subsequent decline is wave 1{-11} within wave 5{-10}, a resumption of the downtrend, and the rise that followed is wave 2{-11}, an upward correction.
Alternative #2: Wave B{-11} within wave 4{-10} is still underway.
If the price remains above the January 24 low, 4212.75, then either the principal analysis or the second alternative is correct. If the price falls below 4212.75, then the first alternative is correct.
Learning and other resources. Elliott wave analysis provides context, not prophecy. As the 20th century semanticist Alfred Korzybski put it this way in his book Science and Sanity (1933), “The map is not the territory … The only usefulness of a map depends on similarity of structure between the empirical world and the map.” And I would add, in the ever-changing markets, we can judge that similarity of structure only after the fact.
See the menu page Analytical Methods for a rundown on where to go for information on Elliott wave analysis.
By Tim Bovee, Portland, Oregon, January 27d, 2022
Disclaimer
Tim Bovee, Private Trader tracks the analysis and trades of a private trader for his own accounts. Nothing in this blog constitutes a recommendation to buy or sell stocks, options or any other financial instrument. The only purpose of this blog is to provide education and entertainment.
No trader is ever 100 percent successful in his or her trades. Trading in the stock and option markets is risky and uncertain. Each trader must make trading decisions for his or her own account, and take responsibility for the consequences.
License
All content on Tim Bovee, Private Trader by Timothy K. Bovee is licensed under a Creative Commons Attribution-ShareAlike 4.0 International License.
Based on a work at www.timbovee.com.

You must be logged in to post a comment.