3:30 p.m. New York time
Half an hour before the closing bell. The S&P 500 dropped during the session, approaching the 23.6% Fibonacci retracement level. I consider this to be a small-scale correction within uptrending wave 5{-9}, but will change my mind if it moves below 4354, the February 14 starting point of wave 5{-9}. A drop below that level could mean that a compound correction is underway, the alternative analysis from this morning. No change (yet) in my analysis. I’ve updated the chart.
10 a.m. New York time
WMT earnings play exit. I’ve exited my short bull put vertical spread on WMT for a 48.7% profit and have updated the entry analysis with full results.
9:35 a.m. New York time
What’s happening now? The S&P 500 E-mini futures continued to trade in a narrow range overnight, remaining close to the 38.2% Fibonacci retracement level.
What does it mean? By my principal analysis, the price is in the early stages of a rise that will complete the upward correction that began on January 24, from 4212.75. Upon completion of the correction, the price will resume the downtrend that began on January 4 from 4808.25.
What’s the alternative? The correction is taking a compound form, in which two or three corrective patterns are strung together. In this case, the price is tracing a rise that will connect the corrective pattern that ended on February 14 with a second pattern.
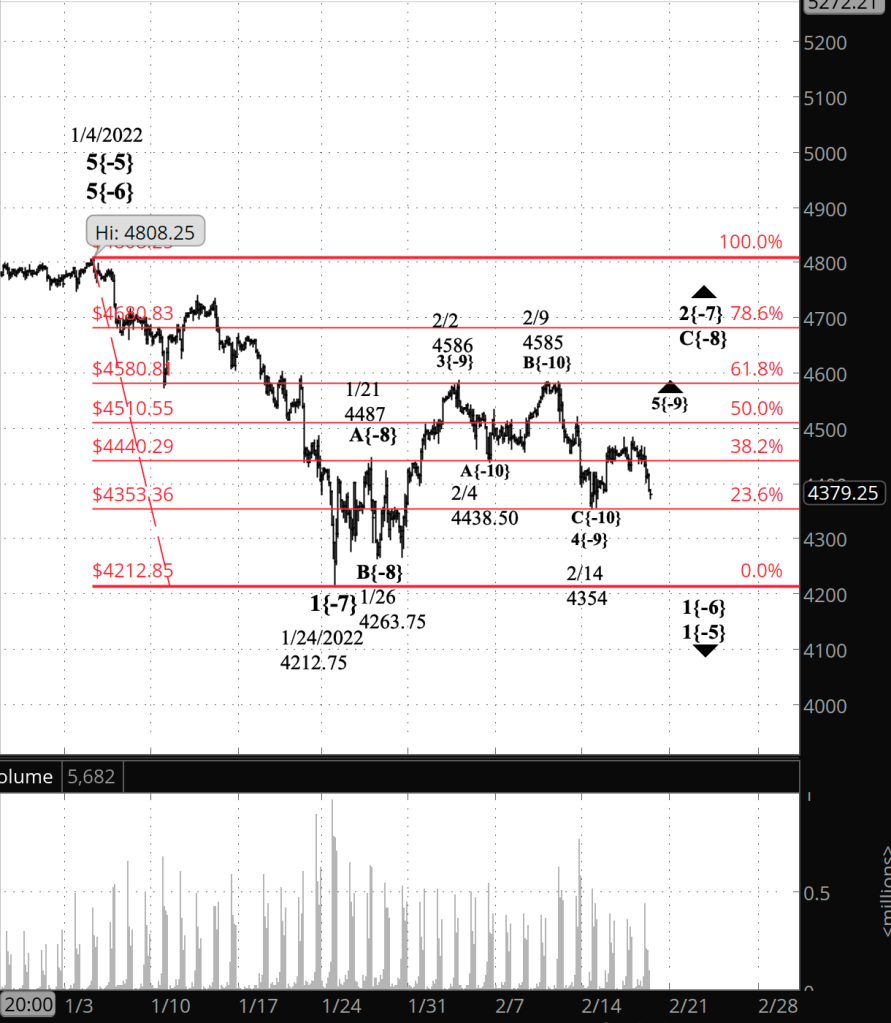
What does Elliott wave theory say? Principal analysis: Wave 5{-9} within wave C{-8} — both of them upward movements — is now underway. The completion of wave 5{-9} will also mark the end of C{-8} and its parent, wave 2{-7}. The subsequent resumption of the downtrend, wave 3{-7} within wave 1{-6}, will carry the price below the the 4212.75 level, perhaps significantly so.
I find the chart to be a bit confusing because of the A-B-C corrections at different levels. For guidance:
- The low of February 14 ended the C wave of {-10} degree, part of a correction at the {-9} degree.
- The subsequent wave, 5{-9}, is part of the C wave of the {-8} degree, part of a correction at the {-7} degree.
- Wave 2{-7} — the larger correction — will end when wave 5{-9} completes wave C{-8}, which in turn completes wave C{-8}, and that event will mark the resumption of the downtrend that began January 4.
Alternative analysis: The wave that connects three-wave corrective patterns within a compound correction are called X waves. If wave 4{-9} is taking the form of a compound correction, then that wave is still underway — wave 5{-9} has not yet begun — and the rise from February 14 is wave X{-10} within wave 4{-9}. It will be followed by another three-wave corrective pattern.
We Are Here.
These are the waves currently in progress under my principal analysis. Each line on the list shows the wave number, with the subscript in curly brackets, the traditional degree name, the starting date, the starting price of the S&P 500 E-mini futures, and the direction of the wave.
- 5{0} Intermediate, 12/21/2018, 2316.75 (up)
- 3{1} Minor, 3/23/2018 2174 (up)
- 5{-2} Minute, 10/4/2020, 4267.50 (up)
- 4{-3} Minuette, 1/4/2022, 4808.25 (down)
- A{-4} Subminuette, 1/4/2022, 4808.25 (down)
- 1{-5} Micro, 1/4/2022, 4808.25 (down)
- 1{-6} Submicro, 1/4/2022, 4808.25 (down)
- 2{-7} Minuscule, 1/24/2022, 4212.75 (up)
- C{-8} Subminuscule, 1/26/2022, 4263.75 (up)
- 5{-9} Bitsy, 2/14/2022, 4354 (up)
Learning and other resources. Elliott wave analysis provides context, not prophecy. As the 20th century semanticist Alfred Korzybski put it this way in his book Science and Sanity (1933), “The map is not the territory … The only usefulness of a map depends on similarity of structure between the empirical world and the map.” And I would add, in the ever-changing markets, we can judge that similarity of structure only after the fact.
See the menu page Analytical Methods for a rundown on where to go for information on Elliott wave analysis.
By Tim Bovee, Portland, Oregon, February 17, 2022
Disclaimer
Tim Bovee, Private Trader tracks the analysis and trades of a private trader for his own accounts. Nothing in this blog constitutes a recommendation to buy or sell stocks, options or any other financial instrument. The only purpose of this blog is to provide education and entertainment.
No trader is ever 100 percent successful in his or her trades. Trading in the stock and option markets is risky and uncertain. Each trader must make trading decisions for his or her own account, and take responsibility for the consequences.
License
All content on Tim Bovee, Private Trader by Timothy K. Bovee is licensed under a Creative Commons Attribution-ShareAlike 4.0 International License.
Based on a work at www.timbovee.com.

You must be logged in to post a comment.