3:30 p.m. New York time
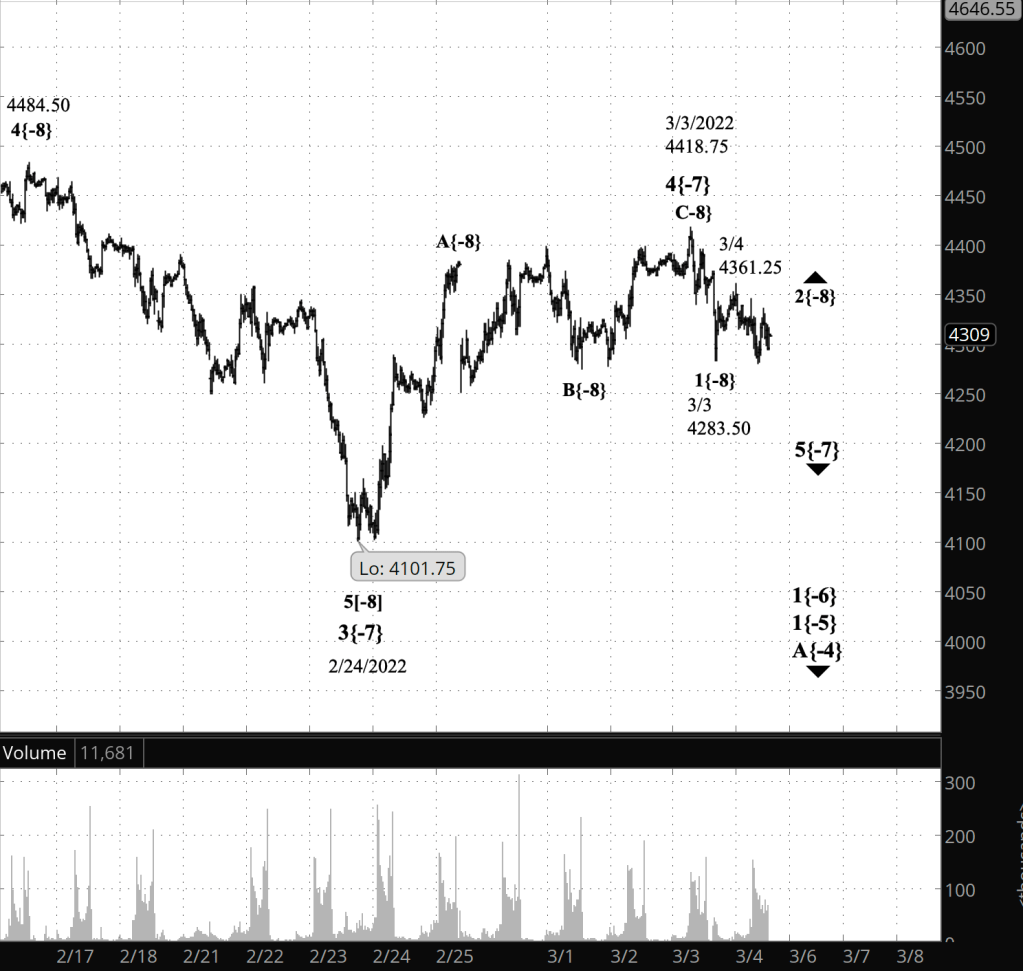
Half an hour before the closing bell. The S&P 500 futures fell from the overnight high, 4361.25, to low of 4281.25 during the day and then rose a bit. Wave 2{-8}, an upward correction, is underway and internally is in either its B (middle) wave to the downside or has started its C (final) wave to the upside. All of this is happening within downtrending wave 5{-7} within downtrending wave 1{-6}. I’ve updated the chart.
9:35 a.m. New York time
What’s happening now? The S&P 500 E-mini futures traded in a narrow range below the 50% retracement of the rise that began on February 24.
What does it mean? By my best reckoning, the March 3 peak marks the end of the upward correction that began on February 24. The final leg of the downtrend that began on January 4 is underway and will carry the price well below 4101.75, the end point of the middle leg of the downtrend.
What’s the alternative? There are two.
Alternative #1: The March 3 peak was the end of the first leg of the upward correction that began on February 24 and is still underway.
Alternative #2: The March 3 peak is the end of the final leg, still underway, of the ongoing upward correction.
What does Elliott wave theory say? Elliott wave analysis is famous for its ambiguities and is illustrating that fact again today. Everything hinges on the interpretation of the March 3 high.
Under my principal analysis, the March 3 high , 4418.75, marked the end of a Zigzag correction that began on February 24 from 4101.75. From that point wave 5{-7} began. It is the final wave within wave 1{-6}, the downtrend that began on January 4.
That principal analysis best fits the chart, in my opinion. However, a strong case can be made for the two alternative counts.
Alternative #1 sees the March 3 high as the end of wave A{-8}, the first leg of the wave 4{-7} upward correction that began on February 24. The subsequent decline under this scenario is wave B{-8}, which will be followed by a rising finale, wave C{-8}, which likely will end wave 4{-7}, unless it forms a compound structure, stringing several corrective patterns together.
Alternative #2, like the principal analysis, sees the March 3 high as being within wave C{-8}, but under this scenario wave C{-8} is not complete.
The principal analysis will be confirmed if the price falls below 4101.75, the end of wave 3{-7}. Alternative #1 will be proven if the price continues to decline but remains above the end of wave 3{-7}. Alternative #2 will be proven if the price moves above the March 3 high, 4418.75.
One note on the principal analysis. I’ve marked the March 3 low as the end of wave 1{-8}. The degree of a movement is at best a guess in the early stages, and that low could well be of a lower degree, {-9} or {-10}. The proper degree labelling will sort itself out as wave 5{-7} continues.
We Are Here.
These are the waves currently in progress under my principal analysis. Each line on the list shows the wave number, with the subscript in curly brackets, the traditional degree name, the starting date, the starting price of the S&P 500 E-mini futures, and the direction of the wave.
- 5{0} Intermediate, 12/21/2018, 2316.75 (up)
- 3{1} Minor, 3/23/2018 2174 (up)
- 5{-2} Minute, 10/4/2020, 4267.50 (up)
- 4{-3} Minuette, 1/4/2022, 4808.25 (down)
- A{-4} Subminuette, 1/4/2022, 4808.25 (down)
- 1{-5} Micro, 1/4/2022, 4808.25 (down)
- 1{-6} Submicro, 1/4/2022, 4808.25 (down)
- 5{-7} Minuscule, 3/3/2022, 4418.75 (down)
- 2{-8} Subminuscule, 3/3/2022, 4283.50 (up)
Learning and other resources. Elliott wave analysis provides context, not prophecy. As the 20th century semanticist Alfred Korzybski put it this way in his book Science and Sanity (1933), “The map is not the territory … The only usefulness of a map depends on similarity of structure between the empirical world and the map.” And I would add, in the ever-changing markets, we can judge that similarity of structure only after the fact.
See the menu page Analytical Methods for a rundown on where to go for information on Elliott wave analysis.
By Tim Bovee, Portland, Oregon, March 4, 2022
Disclaimer
Tim Bovee, Private Trader tracks the analysis and trades of a private trader for his own accounts. Nothing in this blog constitutes a recommendation to buy or sell stocks, options or any other financial instrument. The only purpose of this blog is to provide education and entertainment.
No trader is ever 100 percent successful in his or her trades. Trading in the stock and option markets is risky and uncertain. Each trader must make trading decisions for his or her own account, and take responsibility for the consequences.
License
All content on Tim Bovee, Private Trader by Timothy K. Bovee is licensed under a Creative Commons Attribution-ShareAlike 4.0 International License.
Based on a work at www.timbovee.com.

You must be logged in to post a comment.