3:30 p.m. New York time
Half an hour before the closing bell. The S&P 500 has risen during the trading session but so far has remained below the upward correction’s March 22 high, 4514.75. No change in the analysis. Wave 4{-7} continues and is in its last wave internally, wave C{-8}. When complete, wave 4{-7} will be followed by a resumption of the downtrend, wave 5{-7}, that will carry the price below 4101.75, where the correction began on February 24. I’ve updated the chart.
10 a.m. New York time
DRI earnings play exit. I’ve exited my short bear call options spread on DRI at 25% of maximum potential profit and have updated the trade analysis with full results.
9:35 a.m. New York time
What’s happening now? The S&P 500 E-mini futures rose in overnight trading, remaining below the March 22 high, 4514.75.
What does it mean? The upward correction that began on February 24 is still underway and is in its final phase.
What are the alternatives? There are two.
Alternative #1: The correction might well have ended at the May 22 high. If so, then the subsequent decline and rise are the early stages of a resumption of the downtrend that began on January 4. The principal analysis and this alternative have an equal likelihood of being an accurate description of the S&P 500’s future course.
Alternative #2: It’s also possible that the correction is forming a compound structure, connecting two or three corrective patterns together. If so, then the decline since May 22 is the start of a connecting movement, and it will be followed by a second corrective pattern.
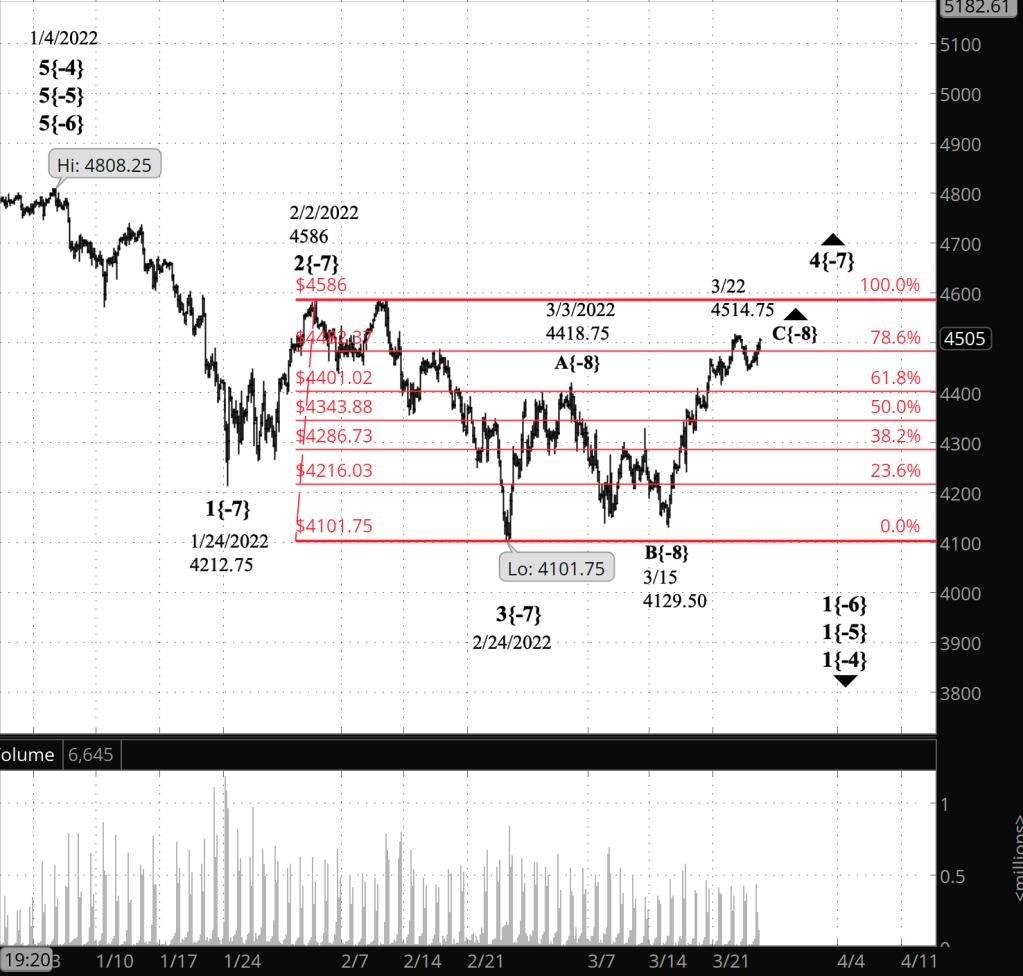
What does Elliott wave theory say? Under my principal analysis, wave C{-8} within wave 4{-7} is in its 5th and final wave internally. When it is complete, ending the upward correction, the downtrend will resume as wave 1{-8} within wave 5{-7}.
Under the first alternative, wave C{-8} and wave 4{-7} ended on May 22 at 4514.75, and wave 1{-8} within wave 5{-7} has begun.
Under the second alternative, the May 22 high completed the first corrective pattern within waver 4{-7}, and the subsequent decline is a connector, wave X{-8}. It will be followed by a second corrective pattern of three waves within wave 4{-7}. It’s also possible that a Triangle pattern could form, with five wavers internally.
There’s no way in the analysis to choose between the principal analysis — wave 4{-7} is underway — and the first alternative — wave 5{-7} is underway. In choosing the ongoing wave 4{-7} scenario as my principal analysis, I’m making a conservative decision. An ongoing wave 4{-7} requires no change in how I trade — a transitioning from bullish to bearish. On the other hand, a new beginning, wave 5{-7}, requires a switch to an aggressively bearish posture.
We Are Here.
These are the waves currently in progress under my principal analysis. Each line on the list shows the wave number, with the subscript in curly brackets, the traditional degree name, the starting date, the starting price of the S&P 500 E-mini futures, and the direction of the wave.
- Index:
- 5{0} Intermediate, 12/26/2018, 2346.58 (up)
- 4{-1} Minor, 1/4/2022 4818.62 (down)
- 1{-2} Minute, 1/4/2022 4818.62 (down)
- Futures and index:
- 1{-3} Minuette, 1/4/2022, 4808.25 (down) (futures), 4818.62 (down) (index)
- Futures:
- 1{-4} Subminuette, 1/4/2022, 4808.25 (down)
- 1{-5} Micro, 1/4/2022, 4808.25 (down)
- 1{-6} Submicro, 1/4/2022, 4808.25 (down)
- 4{-7} Minuscule, 3/3/2022, 4101.75 (up)
- C{-8} Subminuscule, 3/15/2022, 4129.50 (up}
Learning and other resources. Elliott wave analysis provides context, not prophecy. As the 20th century semanticist Alfred Korzybski put it in his book Science and Sanity (1933), “The map is not the territory … The only usefulness of a map depends on similarity of structure between the empirical world and the map.” And I would add, in the ever-changing markets, we can judge that similarity of structure only after the fact.
See the menu page Analytical Methods for a rundown on where to go for information on Elliott wave analysis.
By Tim Bovee, Portland, Oregon, March 24, 2022
Disclaimer
Tim Bovee, Private Trader tracks the analysis and trades of a private trader for his own accounts. Nothing in this blog constitutes a recommendation to buy or sell stocks, options or any other financial instrument. The only purpose of this blog is to provide education and entertainment.
No trader is ever 100 percent successful in his or her trades. Trading in the stock and option markets is risky and uncertain. Each trader must make trading decisions for his or her own account, and take responsibility for the consequences.
License
All content on Tim Bovee, Private Trader by Timothy K. Bovee is licensed under a Creative Commons Attribution-ShareAlike 4.0 International License.
Based on a work at www.timbovee.com.

[…] does it mean? The analysis and the alternatives are a replay of yesterday’s. The upward correction that began on February 24 […]
LikeLike