3:30 p.m. New York time
Half an hour before the closing bell. The S&P 500 rose sharply overnight, reversed shortly after the opening bell, and fell sharply to below where the rise had begun, the wave up can be counted as having five waves internally, although it’s a bit messy. And the subsequent decline counted be counted as having three waves internally, also messy. That pattern is consistent with a Zigzag correction under the principal analysis, and also with a lower-degree correction as set forth in the alternate analysis. Bottom line: I can’t choose between the two. The wave up is wave A{-9} within wave 4{-8} under the principal analysis, and the second, wave B{-9} within wave 4{-8}. For the alternative analysis, push the degrees down by one — A{-11} and B{-11} within wave 4{-10} within wave 5{-9}.
I’ve updated the chart.
1:20 p.m. New York time
JPM earnings play entry. I’ve entered a short bear call options spread on JPM, 38 days before expiration, and have posted an analysis of the trade.
1 p.m. New York time
SPY options position exit. I’ve exited my short bear call options spread on SPY, two days before expiration, for a loss and have posted details of the outcome in the trade analysis.
9:35 a.m. New York time
What’s happening now? The S&P 500 E-mini futures fell to 4382.25 in overnight trading and then reversed, swiftly retracing 38% of the week-long downtrend that began on April 5.
What does it mean? The overnight low was the end of the downtrend and an upward correction has begun.
What’s the alternative? It’s possible, just barely, that the rise is a smaller correction within a continuing downtrend. Given the power of the rise, I don’t buy this alternative, but I can’t rule it out entirely.
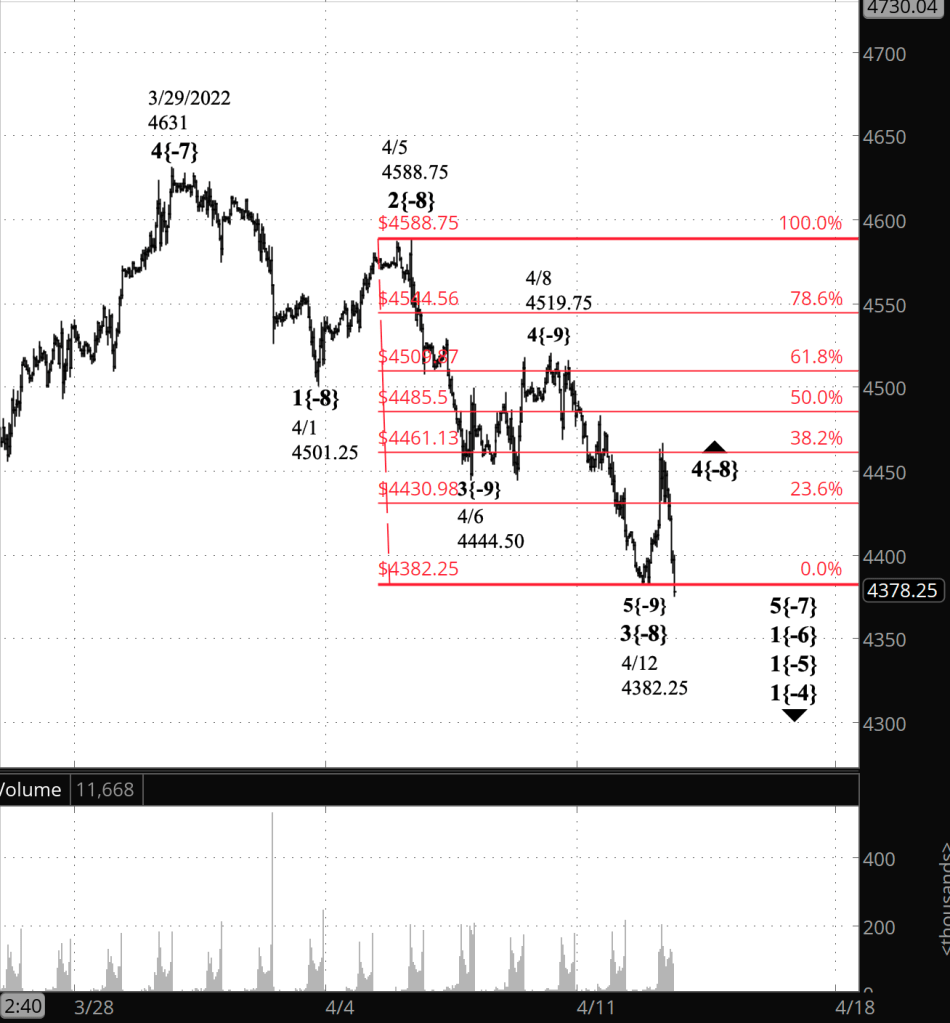
What does Elliott wave theory say? The overnight low marked the end of wave 3{-8}, which began on April 5 from 4588.75, and the beginning of an upward correction, wave 4{-8}. Fourth waves usually end within the range of the 4th subwave within the preceding 3rd wave. In this case, that’s wave 4{-9}, which ran from 4444.30 to 4519.75.
The price, which reached a high of 4462.75 before the opening bell, is already within that range, having retraced 38.2% of the wave 3{-8} decline and paused. That’s a Fibonacci retracement level, a place where pauses often happen during corrections. I’ve placed a Fibonacci retracement ladder on the chart, in red, to better track the levels of retracement.
If wave 4{-8} takes the form of a Flat or a Zigzag, then it will have three internal waves. If it’s a Flat, then waves A and B will each have three subwaves and wave C will have five. If it’s a Zigzag, then waves A and C will each have five subwaves, and wave B will have three.
All of this is happening within downtrending wave 5{-7}, which began on March 29 from 4631, and its parent wave, 1{-6}, which began on January 4 from 4808.25.
Wave 4{-8} will be followed by wave 5{-8}, a resumption of the wave 5{-7} downtrend that began on April 29.
The alternative analysis sees wave 3{-8} continuing its decline and the overnight rise as being an upward correction within the wave 5{-9} child wave of wave 3{-8}.
We Are Here.
These are the waves currently in progress under my principal analysis. Each line on the list shows the wave number, with the subscript in curly brackets, the traditional degree name, the starting date, the starting price of the S&P 500 E-mini futures, and the direction of the wave.
- Index:
- 5{0} Intermediate, 12/26/2018, 2346.58 (up)
- 4{-1} Minor, 1/4/2022 4818.62 (down)
- 1{-2} Minute, 1/4/2022 4818.62 (down)
- Futures and index:
- 1{-3} Minuette, 1/4/2022, 4808.25 (down) (futures), 4818.62 (down) (index)
- Futures:
- 1{-4} Subminuette, 1/4/2022, 4808.25 (down)
- 1{-5} Micro, 1/4/2022, 4808.25 (down)
- 1{-6} Submicro, 1/4/2022, 4808.25 (down)
- 5{-7} Minuscule, 3/29/2022, 4631 (down)
- 4{-8} Subminuscule, 4/12/2022, 4382.25 (up)
Learning and other resources. Elliott wave analysis provides context, not prophecy. As the 20th century semanticist Alfred Korzybski put it in his book Science and Sanity (1933), “The map is not the territory … The only usefulness of a map depends on similarity of structure between the empirical world and the map.” And I would add, in the ever-changing markets, we can judge that similarity of structure only after the fact.
See the menu page Analytical Methods for a rundown on where to go for information on Elliott wave analysis.
By Tim Bovee, Portland, Oregon, April 12, 2022
Disclaimer
Tim Bovee, Private Trader tracks the analysis and trades of a private trader for his own accounts. Nothing in this blog constitutes a recommendation to buy or sell stocks, options or any other financial instrument. The only purpose of this blog is to provide education and entertainment.
No trader is ever 100 percent successful in his or her trades. Trading in the stock and option markets is risky and uncertain. Each trader must make trading decisions for his or her own account, and take responsibility for the consequences.
License
All content on Tim Bovee, Private Trader by Timothy K. Bovee is licensed under a Creative Commons Attribution-ShareAlike 4.0 International License.
Based on a work at www.timbovee.com.

You must be logged in to post a comment.