3:30 p.m. New York time
Half an hour before the closing bell. The S&P 500 has risen during the trading session as a low level upward correction that began on April 17 continues. So far the price has reached more than 100 points above the upward movement’s starting point, 4355.50. No change in the analysis. I’ve updated the chart.
11:30 a.m. New York time
PG earnings play entry. I’ve entered a short bear call options spread on PG timed to coincide with the company’s earnings announcement Wednesday morning before the opening bell and have posted a trade analysis.
11:25 a.m. New York time
WBA earnings play exit. I’ve exited my short iron condor on WBA for 3.5% of maximum potential profit and have updated the trade analysis with results.
10:55 a.m. New York time
JNJ earnings play exit. I’ve exited my short bull put vertical spread on JNJ for 28.8% of maximum potential profit and have updated the trade analysis with results.
9:37 a.m. New York time
What’s happening now? The S&P 500 E-mini futures declined during the overnight session following a small rise.
What does it mean? The downtrend that began on April 5 continues in its last phase.
What’s the alternative? The downtrend that began on April 5 ended on April 17 and the subsequent rise is a correction within that downtrend.
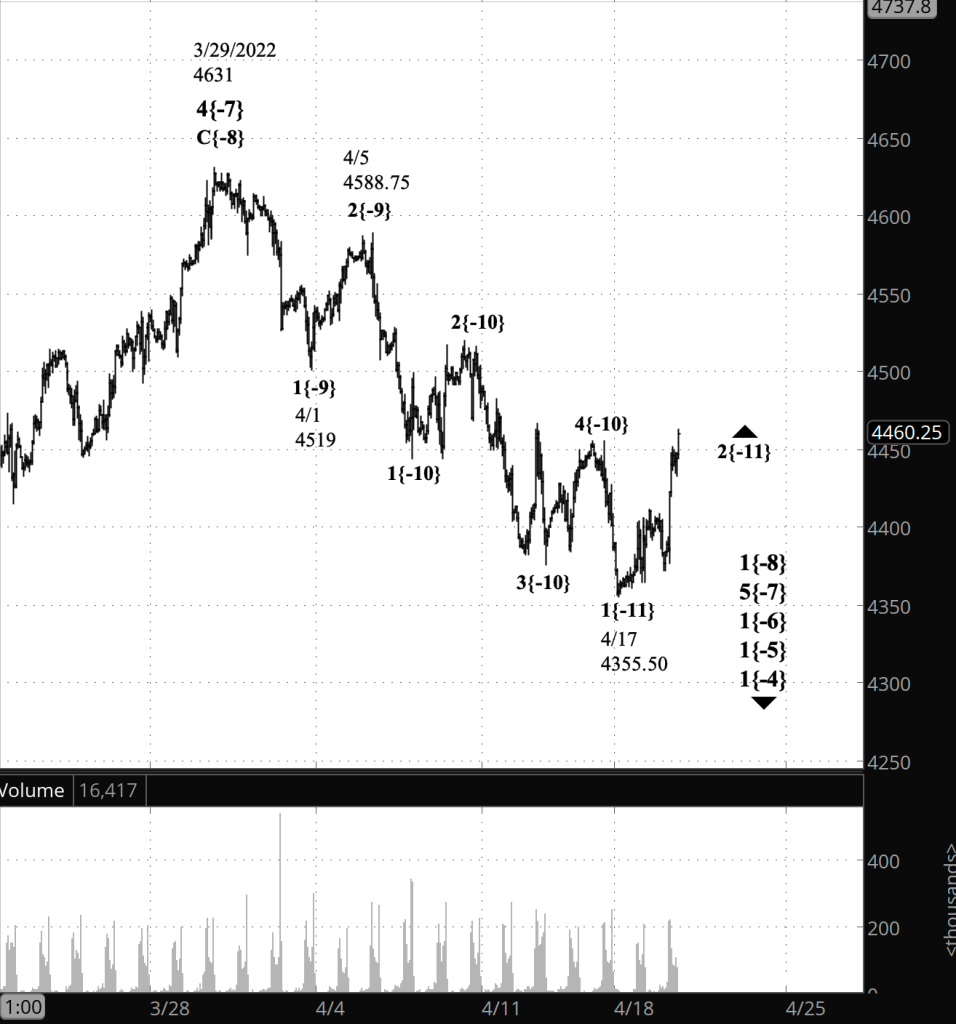
What does Elliott wave theory say? I’ve moved the chart closer in after yesterday’s broad view, in order to see the details of downtrending wave 5{-7}, which began on March 29 from 4631.
Internally, wave 5{-7} is in its 1st wave, 1{-8}, which in turn is in its middle wave, 3{-9}. Under my principal analysis, the upward correction that began on April 17 is of a very low degree, wave 2{-11} within wave 5{-10} within wave 3{-9}.
Under my alternative analysis, the rise that began on April 17 is second correction, wave 4{-9}, within wave 1{-8}. The wave 4{-9} correction is presently in its first wave, A{-10}.
Under my alternative analysis, the rise from April 17 is wave 4{-9}, an upward correction that is presently in its first wave, A{-10}.
At this point the two scenarios have an equal likelihood.
We Are Here.
These are the waves currently in progress under my principal analysis. Each line on the list shows the wave number, with the subscript in curly brackets, the traditional degree name, the starting date, the starting price of the S&P 500 E-mini futures, and the direction of the wave.
- Index:
- 5{0} Intermediate, 12/26/2018, 2346.58 (up)
- 4{-1} Minor, 1/4/2022 4818.62 (down)
- 1{-2} Minute, 1/4/2022 4818.62 (down)
- Futures and index:
- 1{-3} Minuette, 1/4/2022, 4808.25 (down) (futures), 4818.62 (down) (index)
- Futures:
- 1{-4} Subminuette, 1/4/2022, 4808.25 (down)
- 1{-5} Micro, 1/4/2022, 4808.25 (down)
- 1{-6} Submicro, 1/4/2022, 4808.25 (down)
- 5{-7} Minuscule, 3/29/2022, 4631 (down)
- 1{-8} Subminuscule, 3/29/2022, 4631 (down)
- 3{-9} Bitsy, 4/5/2022, 4588.75 (down)
Learning and other resources. Elliott wave analysis provides context, not prophecy. As the 20th century semanticist Alfred Korzybski put it in his book Science and Sanity (1933), “The map is not the territory … The only usefulness of a map depends on similarity of structure between the empirical world and the map.” And I would add, in the ever-changing markets, we can judge that similarity of structure only after the fact.
See the menu page Analytical Methods for a rundown on where to go for information on Elliott wave analysis.
By Tim Bovee, Portland, Oregon, April 19, 2022
Disclaimer
Tim Bovee, Private Trader tracks the analysis and trades of a private trader for his own accounts. Nothing in this blog constitutes a recommendation to buy or sell stocks, options or any other financial instrument. The only purpose of this blog is to provide education and entertainment.
No trader is ever 100 percent successful in his or her trades. Trading in the stock and option markets is risky and uncertain. Each trader must make trading decisions for his or her own account, and take responsibility for the consequences.
License
All content on Tim Bovee, Private Trader by Timothy K. Bovee is licensed under a Creative Commons Attribution-ShareAlike 4.0 International License.
Based on a work at www.timbovee.com.

[…] yesterday’s analysis, wave 1{-11} began at 4455.75 and wave 2{-11}, at 4355.50. A firm rule of Elliott wave analysis is […]
LikeLike