3:30 p.m. New York time
Half an hour before the closing bell. The S&P 500 fell during the session, moving below Monday’s low of 4195.25. Under my principal analysis, wave A{-10} within wave 2{-9} continues.
10:55 a.m. New York time
GM earnings play entry. I’ve entered a short bear call options spread on GM and have posted a trade analysis.
10:45 a.m. New York time
GE earnings play exit. I’ve exited my short bear call options spread on GE for 28.7% of maximum potential profit and have updated the trade analysis with results.
9:35 a.m. New York time
What’s happening now? The S&P 500 E-mini futures rose in overnight trading to 4303.50, which is 108.25 points above Monday’s low. The price then declined slightly.
What does it mean? A low level upward correction is now underway, within the downtrend that began on April 21. When the correction is complete, the downtrend will resume, reaching prices below yesterday’s reversal point.
What’s the alternative? As is often the case, there is ambiguity as to the size of the correction in comparison with the decline that has occurred so far since April 21. It could be one level smaller.
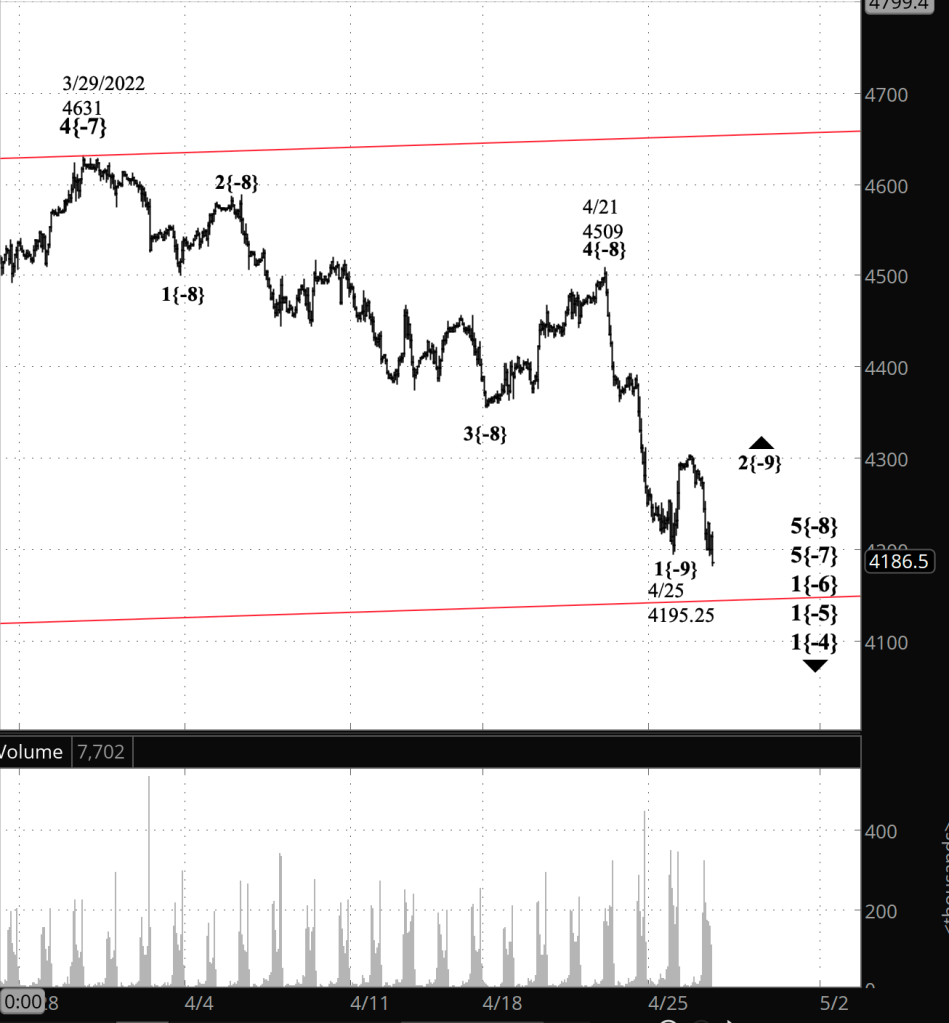
What does Elliott wave theory say? Under my principal analysis, the overnight rise is wave A{-10} within wave 2{-9}, both within declining wave 5{-8} within wave 5{-7} with wave 1{-6}, the largest degree in the list, the 1st wave, having begun on January 4 from 48087.25.
The red lines on the chart are the price channel for wave 1{-6}, connecting the 2nd and 4th wave peaks of the subwaves, with a parallel line through the 2nd wave low.
We Are Here.
These are the waves currently in progress under my principal analysis. Each line on the list shows the wave number, with the subscript in curly brackets, the traditional degree name, the starting date, the starting price of the S&P 500 E-mini futures, and the direction of the wave.
- Index:
- 5{0} Intermediate, 12/26/2018, 2346.58 (up)
- 4{-1} Minor, 1/4/2022 4818.62 (down)
- 1{-2} Minute, 1/4/2022 4818.62 (down)
- Futures and index:
- 1{-3} Minuette, 1/4/2022, 4808.25 (down) (futures), 4818.62 (down) (index)
- Futures:
- 1{-4} Subminuette, 1/4/2022, 4808.25 (down)
- 1{-5} Micro, 1/4/2022, 4808.25 (down)
- 1{-6} Submicro, 1/4/2022, 4808.25 (down)
- 5{-7} Minuscule, 3/29/2022, 4631 (down)
- 5{-8} Subminuscule, 4/21/2022, 4509, (down)
Learning and other resources. Elliott wave analysis provides context, not prophecy. As the 20th century semanticist Alfred Korzybski put it in his book Science and Sanity (1933), “The map is not the territory … The only usefulness of a map depends on similarity of structure between the empirical world and the map.” And I would add, in the ever-changing markets, we can judge that similarity of structure only after the fact.
See the menu page Analytical Methods for a rundown on where to go for information on Elliott wave analysis.
By Tim Bovee, Portland, Oregon, April 26, 2022
Disclaimer
Tim Bovee, Private Trader tracks the analysis and trades of a private trader for his own accounts. Nothing in this blog constitutes a recommendation to buy or sell stocks, options or any other financial instrument. The only purpose of this blog is to provide education and entertainment.
No trader is ever 100 percent successful in his or her trades. Trading in the stock and option markets is risky and uncertain. Each trader must make trading decisions for his or her own account, and take responsibility for the consequences.
License
All content on Tim Bovee, Private Trader by Timothy K. Bovee is licensed under a Creative Commons Attribution-ShareAlike 4.0 International License.
Based on a work at www.timbovee.com.

You must be logged in to post a comment.