3:30 p.m. New York time
Half an hour before the closing bell. The S&P 500 has continued to rise during the session, with small pullbacks along the way, reaching a high today of 4236.25 on the futures. No change in my analysis. An upward correction, wave 2{-9}, continues. In this morning’s analysis I said there was no way to choose between the principal analysis and the first alternative analysis, and that remains true as the session approaches its end. I’ve updated the chart.
12:55 p.m. New York time
PHM earnings play entry. I’ve entered a short bear call vertical spread on PHM and have posted a trade analysis.
12:45 p.m. New Yorktime
GM earnings play exit. I’ve exited my short bear call options spread on GM for 25% of maximum potential profit and have updated the trade analysis with results.
9:35 a.m. New York time
What’s happening now? The S&P 500 E-mini futures rose in overnight trading after Tuesday’s low touched the lower boundary of the price channel (the red lines on the chart) tracking the decline that began January 4.
What does it mean? The length of the decline on Tuesday suggests that the April 25 low wasn’t the end of the first leg of the decline that began on April 21, and I have moved that end point to Tuesday’s low. From that point an upward correction began and is still an an early stage.
What’s the alternative? There is huge ambiguity on this chart regarding the proper position of the decline from April 21 in the hierarchy of waves, what some call the fractal structure of stock price movements, where small movements and large movements all have the same structure. More on this in the Elliott wave theory section, below.
Or, another alternative: The decline may still be underway.
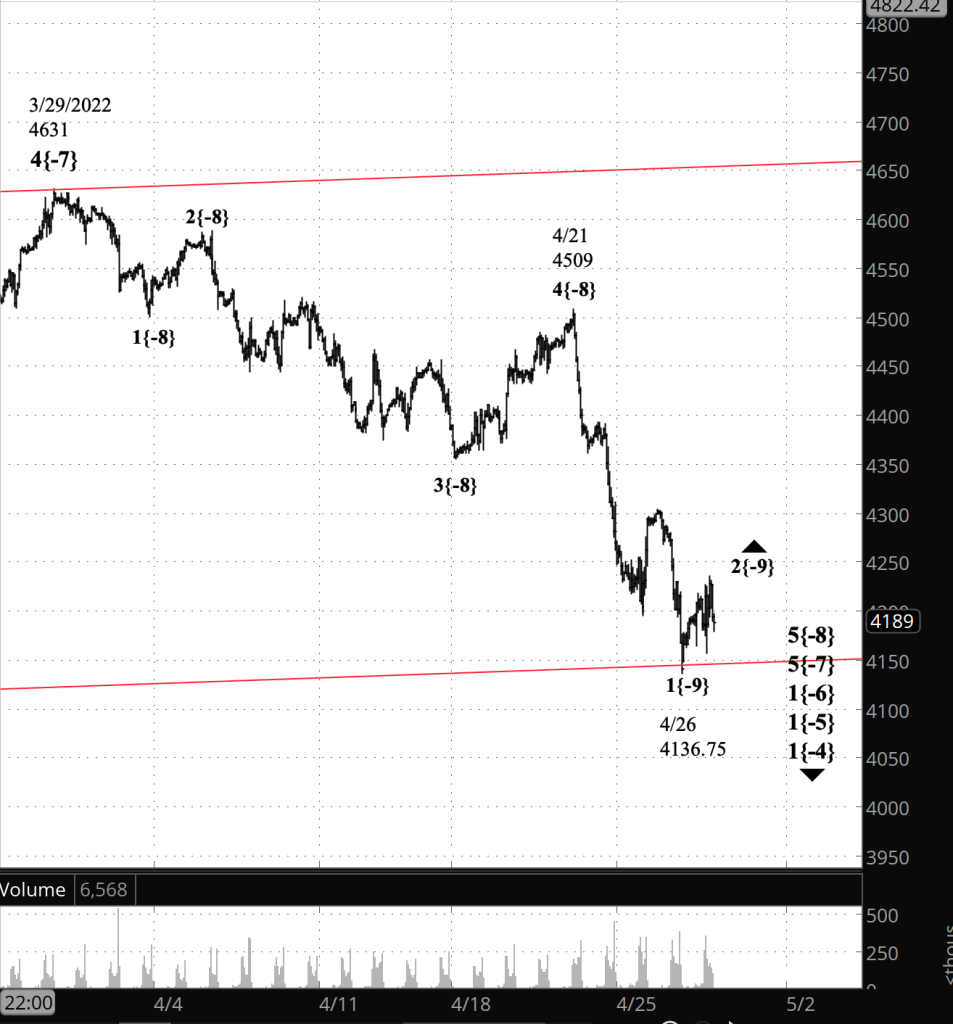
What does Elliott wave theory say? Under my principal analysis, I’ve retained yesterday’s view of the chart, aside from moving the end of wave 1{-9} to yesterday’s low, which is almost perfectly at the lower boundary of the wave 5{-7} price channel, two degrees larger.
But is that low the end of wave 1{-9}, or, as an alternative analysis, is it the end of the parent wave 5{-8}? Based on this chart, at this moment in time, there is no way to choose between the two.
I’ll begin with a caveat. Price channels mark tendencies, not mandates. Prices break through boundaries often. Nonetheless, they also, quite often, respect price channel boundaries.
The under the price channel for wave 1{-6}, the lower boundary marks the likely end of wave 5{-7}, which began on March 29, and the end also of the child wave 5{-8}, which began on April 21. And when 5{-7} ends, that’s also the end of wave 1{-6}, which began on January 4 from 4808.25.
What’s at stake with those two scenarios is the magnitude of the upward correction. Under the principal analysis, the correction is a fairly small wave 2{-9}, likely carrying the price back into the 4300s. Under the alternative analysis, it is a large wave 2{-6}, carrying the price perhaps into the 4600s or even the 4700s.
And as a second alternative, yesterday’s low may not be the end of wave 1{-9} under the principal analysis or wave 5{-8} under the first alternative, but instead may be a pause as the decline continues.
So in a conservative manner, I’ve retained yesterday’s scenario but will be quite willing to change the scenario depending upon how the price moves. A small wave A within the upward correction would suggest that the principal analysis is correct; a large wave A, that the first alternative analysis is correct; and a quick reversal and decline would suggest the second alternative is correct.
We Are Here.
These are the waves currently in progress under my principal analysis. Each line on the list shows the wave number, with the subscript in curly brackets, the traditional degree name, the starting date, the starting price of the S&P 500 E-mini futures, and the direction of the wave.
- Index:
- 5{0} Intermediate, 12/26/2018, 2346.58 (up)
- 4{-1} Minor, 1/4/2022 4818.62 (down)
- 1{-2} Minute, 1/4/2022 4818.62 (down)
- Futures and index:
- 1{-3} Minuette, 1/4/2022, 4808.25 (down) (futures), 4818.62 (down) (index)
- Futures:
- 1{-4} Subminuette, 1/4/2022, 4808.25 (down)
- 1{-5} Micro, 1/4/2022, 4808.25 (down)
- 1{-6} Submicro, 1/4/2022, 4808.25 (down)
- 5{-7} Minuscule, 3/29/2022, 4631 (down)
- 5{-8} Subminuscule, 4/21/2022, 4509, (down)
Learning and other resources. Elliott wave analysis provides context, not prophecy. As the 20th century semanticist Alfred Korzybski put it in his book Science and Sanity (1933), “The map is not the territory … The only usefulness of a map depends on similarity of structure between the empirical world and the map.” And I would add, in the ever-changing markets, we can judge that similarity of structure only after the fact.
See the menu page Analytical Methods for a rundown on where to go for information on Elliott wave analysis.
By Tim Bovee, Portland, Oregon, April 27, 2022
Disclaimer
Tim Bovee, Private Trader tracks the analysis and trades of a private trader for his own accounts. Nothing in this blog constitutes a recommendation to buy or sell stocks, options or any other financial instrument. The only purpose of this blog is to provide education and entertainment.
No trader is ever 100 percent successful in his or her trades. Trading in the stock and option markets is risky and uncertain. Each trader must make trading decisions for his or her own account, and take responsibility for the consequences.
License
All content on Tim Bovee, Private Trader by Timothy K. Bovee is licensed under a Creative Commons Attribution-ShareAlike 4.0 International License.
Based on a work at www.timbovee.com.

You must be logged in to post a comment.