3:30 p.m. New York time
Half an hour before the closing bell. The S&P 500 has risen during the session, exceeding 4300 on both the index and the futures. The upward correction that began on April 26 from 4136.75 on the futures — wave 2{-9} — is underway. This morning’s second alternative was that downtrending wave 1{-9} is still underway and the present rise is a lower degree correction; the higher the present rise goes, the less likely that second alternative becomes. I’d say it’s chances are fading fast. I’ve updated the chart below.
12:55 p.m. New York time
GILD earnings play entry. I’ve entered a short bull put optIons spread on GILD, timed to coincide with the company’s earnings announcement, and have posted an analysis of the trade.
9:35 a.m. New York time
What’s happening now? The S&P 500 E-mini futures price continued to work its way higher overnight, reaching a high of 4258.75.
What does it mean? The upward correction that began on April 26 is still underway, taking back some of the downtrend that began on April 21.
What’s the alternative? It’s possible that the correction is larger than I have labeled it and will take back a portion of the decline that began on January 4.
It’s also possible that the decline that began on April 21 has not yet ended and no correction has begun.
It is a very ambiguous chart.
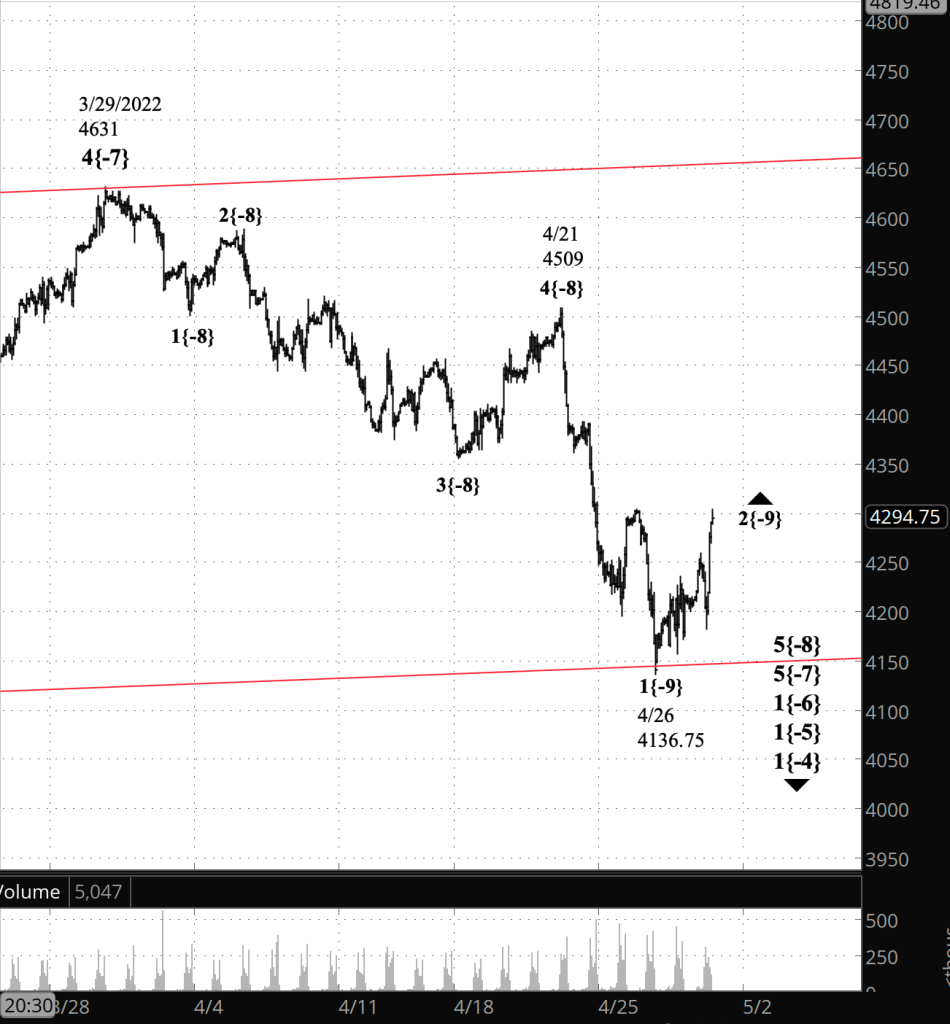
What does Elliott wave theory say? Under my principal analysis, wave 1{-9} ended on April 26 and wave 2{-9} began, retracing part of the decline that began from 4509.
Under my first alternative analysis, wave 5{-8}, which began on April 21, ended on on April 26, also triggering the end of parent waves 5{-7}, which began on March 29, and 1{-6}, which, as noted above, ended on January 4. In this case, wave 2{-6} is underway and will retrace part of the decline that began from 4808.25 — a much bigger correction.
Under my second alternative analysis, wave 1{-9} within wave 5{-8} within wave 5{-7} within wave 1{-6} is still underway — downtrends all the way down the list.
The red lines on the chart are the price channel of wave downtrending 1{-7}.
We Are Here.
These are the waves currently in progress under my principal analysis. Each line on the list shows the wave number, with the subscript in curly brackets, the traditional degree name, the starting date, the starting price of the S&P 500 E-mini futures, and the direction of the wave.
- Index:
- 5{0} Intermediate, 12/26/2018, 2346.58 (up)
- 4{-1} Minor, 1/4/2022 4818.62 (down)
- 1{-2} Minute, 1/4/2022 4818.62 (down)
- Futures and index:
- 1{-3} Minuette, 1/4/2022, 4808.25 (down) (futures), 4818.62 (down) (index)
- Futures:
- 1{-4} Subminuette, 1/4/2022, 4808.25 (down)
- 1{-5} Micro, 1/4/2022, 4808.25 (down)
- 1{-6} Submicro, 1/4/2022, 4808.25 (down)
- 5{-7} Minuscule, 3/29/2022, 4631 (down)
- 5{-8} Subminuscule, 4/21/2022, 4509, (down)
Learning and other resources. Elliott wave analysis provides context, not prophecy. As the 20th century semanticist Alfred Korzybski put it in his book Science and Sanity (1933), “The map is not the territory … The only usefulness of a map depends on similarity of structure between the empirical world and the map.” And I would add, in the ever-changing markets, we can judge that similarity of structure only after the fact.
See the menu page Analytical Methods for a rundown on where to go for information on Elliott wave analysis.
By Tim Bovee, Portland, Oregon, April 28, 2022
Disclaimer
Tim Bovee, Private Trader tracks the analysis and trades of a private trader for his own accounts. Nothing in this blog constitutes a recommendation to buy or sell stocks, options or any other financial instrument. The only purpose of this blog is to provide education and entertainment.
No trader is ever 100 percent successful in his or her trades. Trading in the stock and option markets is risky and uncertain. Each trader must make trading decisions for his or her own account, and take responsibility for the consequences.
License
All content on Tim Bovee, Private Trader by Timothy K. Bovee is licensed under a Creative Commons Attribution-ShareAlike 4.0 International License.
Based on a work at www.timbovee.com.

You must be logged in to post a comment.