3:30 p.m. New York time
Half an hour before the closing bell. The S&P 500 has continued its decline throughout the trading session. So far wave B{-11} has retraced 124% of wave A{-11}, within the guidelines for a Flat pattern, which usually retraces 100% to 138%. I’ve updated the chart below, having added in a Fibonacci retracement grid.
1:05 p.m. New York time
SPG earnings play entry. I’ve opened a short bull put options spread on SPG, which announces earnings today after the closing bell, and have posted an analysis of the trade.
9:35 a.m. New York time
What’s happening now? The S&P 500 E-mini futures continued to fall after trading resumed overnight, reaching below the May 2 low to 4031 so far.
What does it mean? The falling middle segment of the upward correction that began on May 2 is still underway. It will be followed by a rising segment that will carry the price to around 4,300 or perhaps higher, likely ending the correction.
What’s the alternative? The chart can be interpreted as showing that the upward correction began on April 26, with the first segment ending on April 28, the middle segment on May 2 and the final segment on May 4. Under this scenario, the correction has ended and the downtrend that began on April 29 has begun.
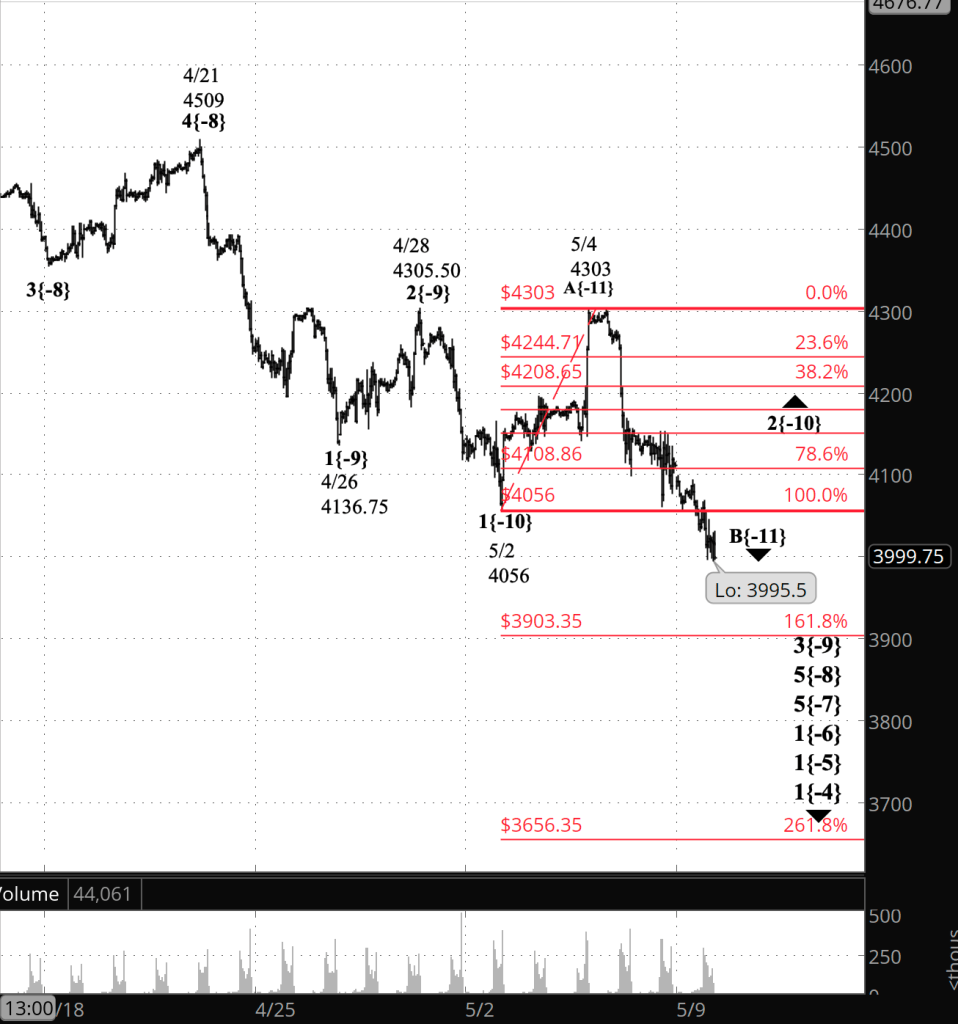
What does Elliott wave theory say? Under my principal analysis, the decline that began on May 4 and that is still underway is wave B{-11} within wave 2{-9}, an upward correction that began on May 2. The B wave’s decline below 4056 , wave 2{-9}’s starting point, suggests that the 2nd wave is taking the form of a Flat rather than a Zigzag, the latter being a more common form for 2nd waves.
Under this scenario, wave C{-11} following the B wave will carry the price above the end of wave A{-11} at 4303. One difficulty in interpreting wave 2{-10} to be a Flat pattern is the lack of clarity in the A wave. In a Flat, that wave should have three waves internally. In a Zigzag, it will have five internal waves. If the pattern is a Flat, wave C{-11} can move above the start of wave 1{-10} under the rules of Elliott wave analysis. If it’s a Zigzag, then the 2nd wave can’t move above the 1st wave’s starting point and would force a re-analysis. Everything — everything! — depends upon how the rise from May 2 to May 4 is counted.
Under the alternative analysis, the upward correction is wave 2{-9} and began on April 26 from 4136.75. Wave A{-10} ended on April 28, wave B{-10} ended on May 2, and wave C{-10} ended on May 4. The present decline that followed is the first steps of wave 3{-9}, which will carry the price significantly lower.
All of this is happening within a series of downtrending waves of increasing degree: Wave 5{-8}, which began on April 21, within wave 5{-8}, which began on March 29, within wave 1{-6}, which began on January 4.
We Are Here.
These are the waves currently in progress under my principal analysis. Each line on the list shows the wave number, with the subscript in curly brackets, the traditional degree name, the starting date, the starting price of the S&P 500 E-mini futures, and the direction of the wave.
- Index:
- 5{0} Intermediate, 12/26/2018, 2346.58 (up)
- 4{-1} Minor, 1/4/2022 4818.62 (down)
- 1{-2} Minute, 1/4/2022 4818.62 (down)
- Futures and index:
- 1{-3} Minuette, 1/4/2022, 4808.25 (down) (futures), 4818.62 (down) (index)
- Futures:
- 1{-4} Subminuette, 1/4/2022, 4808.25 (down)
- 1{-5} Micro, 1/4/2022, 4808.25 (down)
- 1{-6} Submicro, 1/4/2022, 4808.25 (down)
- 5{-7} Minuscule, 3/29/2022, 4631 (down)
- 5{-8} Subminuscule, 4/21/2022, 4509, (down)
Learning and other resources. Elliott wave analysis provides context, not prophecy. As the 20th century semanticist Alfred Korzybski put it in his book Science and Sanity (1933), “The map is not the territory … The only usefulness of a map depends on similarity of structure between the empirical world and the map.” And I would add, in the ever-changing markets, we can judge that similarity of structure only after the fact.
See the menu page Analytical Methods for a rundown on where to go for information on Elliott wave analysis.
By Tim Bovee, Portland, Oregon, May 9, 2022
Disclaimer
Tim Bovee, Private Trader tracks the analysis and trades of a private trader for his own accounts. Nothing in this blog constitutes a recommendation to buy or sell stocks, options or any other financial instrument. The only purpose of this blog is to provide education and entertainment.
No trader is ever 100 percent successful in his or her trades. Trading in the stock and option markets is risky and uncertain. Each trader must make trading decisions for his or her own account, and take responsibility for the consequences.
License
All content on Tim Bovee, Private Trader by Timothy K. Bovee is licensed under a Creative Commons Attribution-ShareAlike 4.0 International License.
Based on a work at www.timbovee.com.

You must be logged in to post a comment.