3:30 p.m. New York time
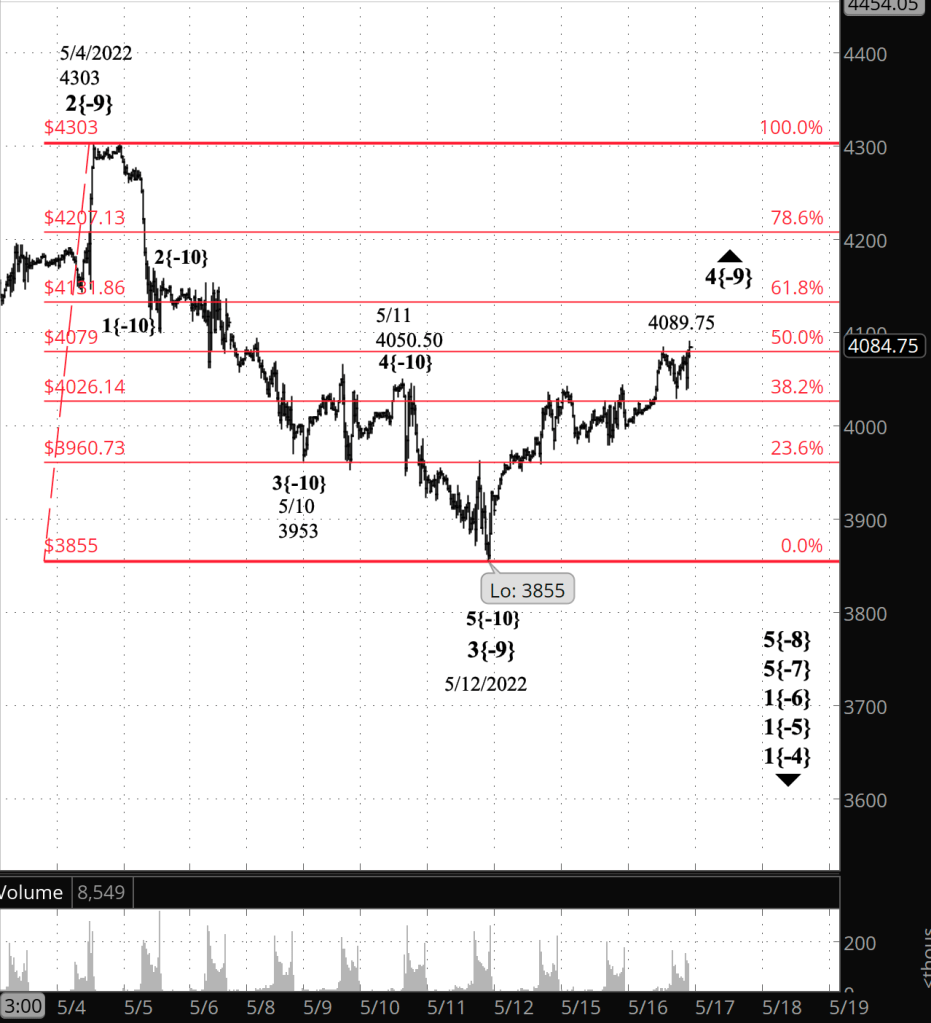
Half an hour before the closing bell. The S&P 500 rose six points above the overnight high, to 4089.75 on the futures. The price declined to a 38.2% retracement of the decline from May 4 to May 12 and then moved back up to a 50% retracement. The upward correction, wave 4{-9}, continues. No change in the analysis. I’ve updated the chart.
1:30 p.m. New York time
LOW earnings play entry. I’ve entered a short bull put vertical spread, using options that expire on June 17, and have posted an analysis of the trade.
12:55 p.m. New York time
HD earnings play exit. I’ve exited my short bull put options spread on HD for 64.9% of maximum potential profit and have updated the trade analysis with results.
9:35 a.m. New York time
What’s happening now? The S&P 500 E-mini futures continued to rise overnight, reaching into the 4080s.
What does it mean? I’ve revised the principal analysis to accommodate the length of the rise. The March 12 low marks the end of the downtrend that began on May 4 from 4303. The subsequent rise is an upward correction that has so far retraced 50% of the decline. I’ve placed a Fibonacci retracement grid over the chart.
What’s the alternative? If the price moves above 4303, the high of May 4, then the count may require a revision. I discuss the reasoning behind that conclusion in the Elliott wav theory section below.
What does Elliott wave theory say? The Elliott wave theory rule that required a reanalysis imposes a limitation on 4th waves: They never move beyond the end of the preceding 1st wave. Under my previous analysis (see yesterday’s Trader’s Notebook), the uptrend that began May 12 was labeled as wave 4{-11}. Its overnight move beyond the end of wave 1{-11} meant the labeling no longer matched the chart — the map no longer matched the territory.
Under the new analysis, I’ve raised the degree of waves within the decline that began on May 4 — wave 3{-9} — and labelled the low of May 12, at 3855, as the end of that decline. The subsequent rise is wave 4{-9}, an upward correction that will likely take the form of a Flat.
Wave 4{-9}, of course, has the same limitation as any 4th wave: It can’t move beyond the end of wave 1{-9}, which is 4303, attained on May 4.
One quirk of the labeling is the placement of waves 1{-10} and 2{-10}. That 2nd wave is extraordinarily small. It doesn’t mean it’s wrong, but it is unusual, perhaps showing the power of the bearish sentiment in early May. I chose that labeling to ensure that wave 3{-10} wouldn’t be shorter than both wave 1{-10} and 5{10}.
We Are Here.
These are the waves currently in progress under my principal analysis. Each line on the list shows the wave number, with the subscript in curly brackets, the traditional degree name, the starting date, the starting price of the S&P 500 E-mini futures, and the direction of the wave.
- Index:
- 5{0} Intermediate, 12/26/2018, 2346.58 (up)
- 4{-1} Minor, 1/4/2022 4818.62 (down)
- 1{-2} Minute, 1/4/2022 4818.62 (down)
- Futures and index:
- 1{-3} Minuette, 1/4/2022, 4808.25 (down) (futures), 4818.62 (down) (index)
- Futures:
- 1{-4} Subminuette, 1/4/2022, 4808.25 (down)
- 1{-5} Micro, 1/4/2022, 4808.25 (down)
- 1{-6} Submicro, 1/4/2022, 4808.25 (down)
- 5{-7} Minuscule, 3/29/2022, 4631 (down)
- 5{-8} Subminuscule, 4/21/2022, 4509, (down)
Learning and other resources. Elliott wave analysis provides context, not prophecy. As the 20th century semanticist Alfred Korzybski put it in his book Science and Sanity (1933), “The map is not the territory … The only usefulness of a map depends on similarity of structure between the empirical world and the map.” And I would add, in the ever-changing markets, we can judge that similarity of structure only after the fact.
See the menu page Analytical Methods for a rundown on where to go for information on Elliott wave analysis.
By Tim Bovee, Portland, Oregon, May 17, 2022
Disclaimer
Tim Bovee, Private Trader tracks the analysis and trades of a private trader for his own accounts. Nothing in this blog constitutes a recommendation to buy or sell stocks, options or any other financial instrument. The only purpose of this blog is to provide education and entertainment.
No trader is ever 100 percent successful in his or her trades. Trading in the stock and option markets is risky and uncertain. Each trader must make trading decisions for his or her own account, and take responsibility for the consequences.
License
All content on Tim Bovee, Private Trader by Timothy K. Bovee is licensed under a Creative Commons Attribution-ShareAlike 4.0 International License.
Based on a work at www.timbovee.com.

You must be logged in to post a comment.