3:30 p.m. New York time
Half an hour before the closing bell. The S&P 500 traded in a narrow range during the session, remaining fewer than 90 points above the overnight low on the futures. No change in the analysis. I’ve updated the chart.
2:05 p.m. New York time
FL earnings play entry. I’ve entered an earnings play on FL, using options that expire in 29 days, and have posted an analysis of the trade.
9:35 a.m. New York time
What’s happening now? The S&P 500 E-mini futures fell overnight to 3856, a point above the starting point of the upward correction that began on May 12, and then rose slightly.
What does it mean? The upward correction is in its second leg, and how much further the price can fall will depend upon what form the correction is taking. Under my principal analysis, the correction is a Flat and could reach as low as the 3760s.
What’s the alternative? Under my first alternative analysis, the correction taking the form of a Zigzag, which never moves below the start of the first leg of a correction. The downside potential is one point, to 3855.
Under a second alternative analysis, the entire upward correction ended on May 17 and there is no specified limit to the downside.
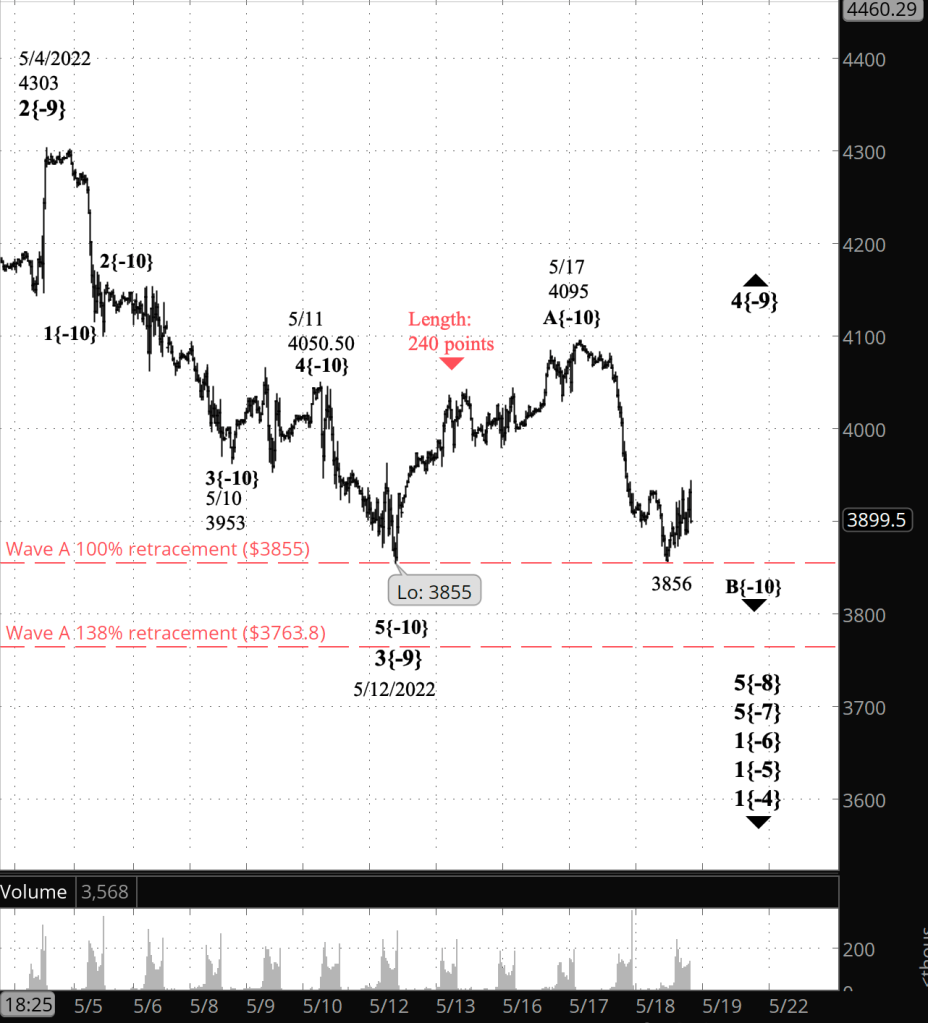
What does Elliott wave theory say? Wave 4{-9}, an upward correction, began May 12 from 3855. On that all three possible analyses agree.
Under my principal analysis, the first wave within the correction, wave A{-10}, has three waves internally, meaning that the correction is taking the form of a Flat, with three subwaves within the A wave. This is the more common form of a 4th wave correction. The B wave of a Flat often will retrace 100% to 138% of the preceding A wave (the dotted red lines on the chart), bringing the price potentially as low as 3763.80. This is the scenario shown in the chart.
Under my first alternative analysis, wave A{-10} has five waves internally meaning that the correction is taking the form of a Zigzag. The A-wave count is a bit messy, and I can see it as five waves or three, depending upon how I define the degree of each movement within the wave. The B wave of a Zigzag never moves below the start of the preceding A wave. The B wave’s overnight low, 3856, is one point above the start of wave A (the top dotted red line on the chart).
Under my second alternative analysis, the rise from May 12 to May 17 is the entirety of wave 4{-9}, with three waves within it. Under this scenario, the decline now underway is wave 5{-9}, and there is no limit to how low it can go, beyond the need for waves of the same degree to be more or less proportionally similar to each other.
What the chart shows as wave B{-10} is consistent with both the principal and first alternative analyses, and with the second analysis, if the wave is renumbered to wave 5{-9}. A dip below 3855 would eliminate the first alternative — the Zigzag scenario. A move below 3763.80 would most likely eliminate the principal analysis — the Flat scenario. If both are eliminated, then the 5th wave scenario remains.
We Are Here.
These are the waves currently in progress under my principal analysis. Each line on the list shows the wave number, with the subscript in curly brackets, the traditional degree name, the starting date, the starting price of the S&P 500 E-mini futures, and the direction of the wave.
- Index:
- 5{0} Intermediate, 12/26/2018, 2346.58 (up)
- 4{-1} Minor, 1/4/2022 4818.62 (down)
- 1{-2} Minute, 1/4/2022 4818.62 (down)
- Futures and index:
- 1{-3} Minuette, 1/4/2022, 4808.25 (down) (futures), 4818.62 (down) (index)
- Futures:
- 1{-4} Subminuette, 1/4/2022, 4808.25 (down)
- 1{-5} Micro, 1/4/2022, 4808.25 (down)
- 1{-6} Submicro, 1/4/2022, 4808.25 (down)
- 5{-7} Minuscule, 3/29/2022, 4631 (down)
- 5{-8} Subminuscule, 4/21/2022, 4509, (down)
Learning and other resources. Elliott wave analysis provides context, not prophecy. As the 20th century semanticist Alfred Korzybski put it in his book Science and Sanity (1933), “The map is not the territory … The only usefulness of a map depends on similarity of structure between the empirical world and the map.” And I would add, in the ever-changing markets, we can judge that similarity of structure only after the fact.
See the menu page Analytical Methods for a rundown on where to go for information on Elliott wave analysis.
By Tim Bovee, Portland, Oregon, May 19, 2022
Disclaimer
Tim Bovee, Private Trader tracks the analysis and trades of a private trader for his own accounts. Nothing in this blog constitutes a recommendation to buy or sell stocks, options or any other financial instrument. The only purpose of this blog is to provide education and entertainment.
No trader is ever 100 percent successful in his or her trades. Trading in the stock and option markets is risky and uncertain. Each trader must make trading decisions for his or her own account, and take responsibility for the consequences.
License
All content on Tim Bovee, Private Trader by Timothy K. Bovee is licensed under a Creative Commons Attribution-ShareAlike 4.0 International License.
Based on a work at www.timbovee.com.

You must be logged in to post a comment.