3:30 p.m. New York time
Half an hour before the closing bell. The S&P 500 rose during the session, entering the target price range on the futures. The rise is part of wave C{-10} within an upward correction, wave 4{-9}. As I count it, the C wave internally is in its middle subwave, wave 3{-11}.
When that 3rd subwave is complete, it will be followed by wave 4{-11}, which typically would take the form of a Flat correction, and then will finish off with a final rise, wave 5{-11}. That will be the end of wave C{-10} and of wave 4{-9} under my principal analysis, although 4{-9} will continue if it turns out to be a compound correction, discussed in the alternative analysis.
I’ve updated the vchart.
2:25 p.m. New York time
MRVL earnings play entry. I’ve entered a short bull put vertical spread on MRVL, using options that expire 22 days from now, and have posted a trade analysis.
11:05 a.m. New York time
DLTR earnings play exit. DLTR beat analysts’ earnings expectations, the share price rose by 18.8%, and I exited my short bear call vertical options spread for all of the maximum potential loss, plus some. I’ve updated the trade analysis with details.
OLLI earnings announcement date changed. The earnings announcement date listed for OLLI changed after I entered the position. The new earnings announcement date is listed as June 8 before the opening bell. I’ll hold on to the position, exit if it turns profitable before the announcement, and otherwise wait to see how the announcement goes. I posted a trade analysis at the time I entered the position.
9:35 a.m. New York time
What’s happening now? The S&P 500 E-mini futures rose above 4000 in overnight trading.
What does it mean? The final leg of an upward correction continues and is less than 50 points below the range that will likely mark the high point of the rise.
What’s the alternative? The present rise is the final segment of a three-wave correction. However, sometimes corrections take a compound form. if that happens, then the present rise won’t be the final leg of the correction.
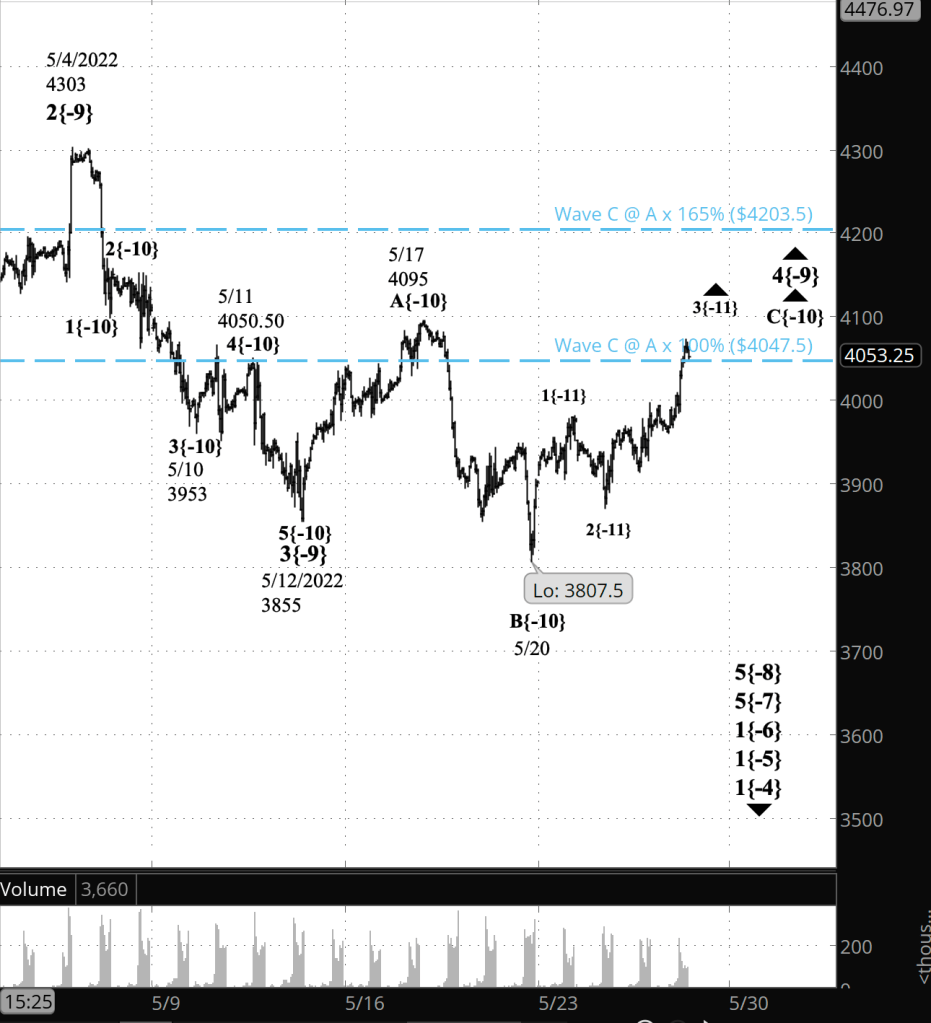
What does Elliott wave theory say? Wave C{-10} within with 4{-9} is underway. Internally, the C wave will have five waves and is presently in wave 3{-11}.
Wave C is likely to end within the range marked with blue dashed lines on the chart, between 4047.50 and 4203.50.
If the alternative scenario plays out, then wave C{-10} will be followed by a connector, wave X{-10} and then a second corrective pattern, all within the wave 4{-9} upward correction.
We Are Here.
These are the waves currently in progress under my principal analysis. Each line on the list shows the wave number, with the subscript in curly brackets, the traditional degree name, the starting date, the starting price of the S&P 500 E-mini futures, and the direction of the wave.
- S&P 500 Index:
- 5{+3} Supercycle, 7/8/1932, 4.40 (up)
- 5{+2} Cycle, 12/9/1974, 60.96 (up)
- 5{+1} Primary, 3/6/2009, 666.79 (up)
- 5{0} Intermediate, 12/26/2018, 2346.58 (up)
- 4{-1} Minor, 1/4/2022 4818.62 (down)
- 1{-2} Minute, 1/4/2022 4818.62 (down)
- S&P 500 Futures and index:
- 1{-3} Minuette, 1/4/2022, 4808.25 (down) (futures), 4818.62 (down) (index)
- S&P 500 Futures:
- 1{-4} Subminuette, 1/4/2022, 4808.25 (down)
- 1{-5} Micro, 1/4/2022, 4808.25 (down)
- 1{-6} Submicro, 1/4/2022, 4808.25 (down)
- 5{-7} Minuscule, 3/29/2022, 4631 (down)
- 5{-8} Subminuscule, 4/21/2022, 4509, (down)
Learning and other resources. Elliott wave analysis provides context, not prophecy. As the 20th century semanticist Alfred Korzybski put it in his book Science and Sanity (1933), “The map is not the territory … The only usefulness of a map depends on similarity of structure between the empirical world and the map.” And I would add, in the ever-changing markets, we can judge that similarity of structure only after the fact.
See the menu page Analytical Methods for a rundown on where to go for information on Elliott wave analysis.
By Tim Bovee, Portland, Oregon, May 26, 2022
Disclaimer
Tim Bovee, Private Trader tracks the analysis and trades of a private trader for his own accounts. Nothing in this blog constitutes a recommendation to buy or sell stocks, options or any other financial instrument. The only purpose of this blog is to provide education and entertainment.
No trader is ever 100 percent successful in his or her trades. Trading in the stock and option markets is risky and uncertain. Each trader must make trading decisions for his or her own account, and take responsibility for the consequences.
License
All content on Tim Bovee, Private Trader by Timothy K. Bovee is licensed under a Creative Commons Attribution-ShareAlike 4.0 International License.
Based on a work at www.timbovee.com.

You must be logged in to post a comment.