3:30 p.m. New York time
Half an hour before the closing bell. The S&P 500 has risen during the session, reaching the upper 3800s on the futures, a level above the upper boundary of the price target range. By my count wave C{-12} has fulfilled all of its requirements, and its just a question of how far the final subwave, a 5th, will travel.
11 a.m. New York time
FDX earnings play exit. I’ve exited my short bull put options spread on FDX for 38.7% of maximum potential profit, exceeding my normal goal of 25% of max, and have updated the trade analysis with results.
9:35 a.m. New York time
What’s happening now? The S&P 500 E-mini futures reached into the mid-3800s in overnight trading.
What does it mean? The upward correction that began on June 14 continues, is in its last leg, and is trading within the likely price target range of that final segment, between 3773.50 and 3860.93. The correction will be followed by a resumption of the downtrend that began on June 2.
The upper and lower boundaries of the price target range are marked on the chart by dashed lines.
What is the alternative? Some corrections form a compound structure, containing two or three corrective patterns. If that occurs, then the end of the present rise won’t be the end of the correction but will instead be followed by a connecting wave and then a second corrective pattern.
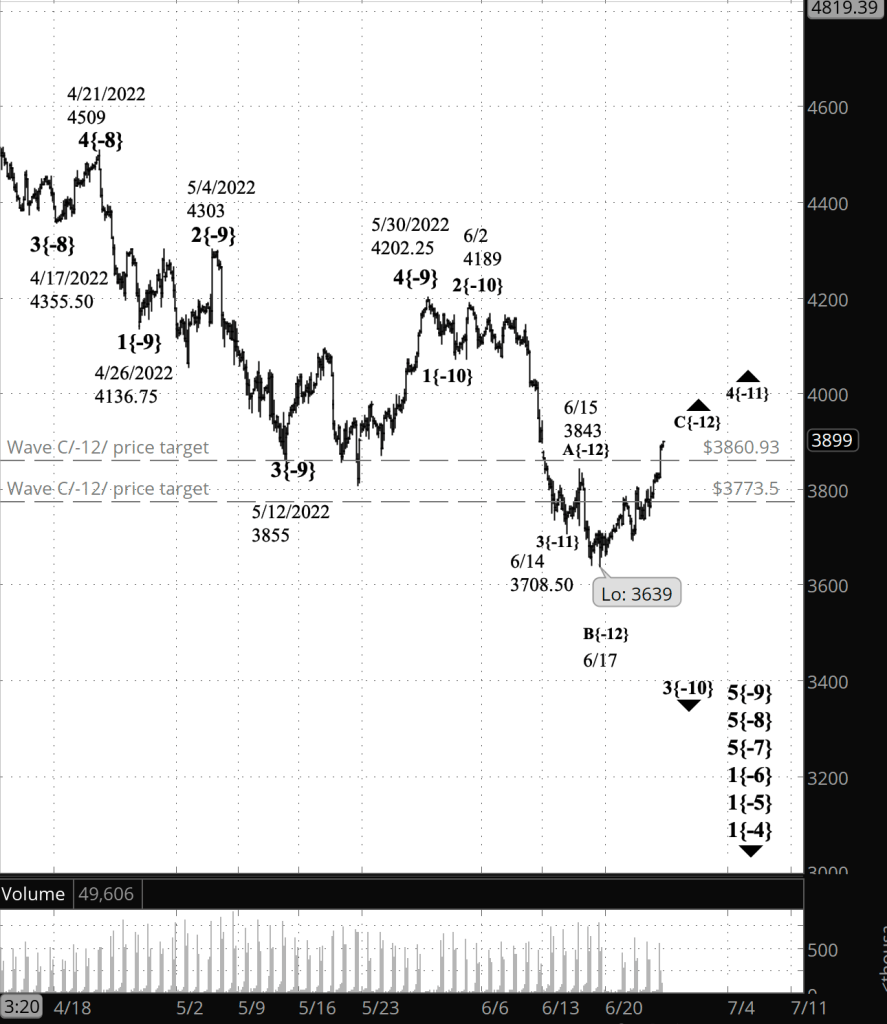
What does Elliott wave theory say? On the upper chart, wave C{-12}, the third and most likely final subwave within an upward correction, wave 4{-11}, is itself in its final segment, wave 5{-13}.
Most 4th waves end with the third subwave. Sometimes the correction creates a compound structure of two or three corrective patterns separated by connecting waves. If that occurs within wave 4{-11}, then upward wave C{-12}, the end of the first corrective pattern, will be followed by downward wave X{-11} — the connector — and then a second corrective pattern. Such an expansion is called a compound correction in Elliott wave terminology and can contain up to three corrective patterns.
Wave 4{-11} has taken the form of a Flat, and the C wave of that pattern tends to be 100% to 165% as long a the preceding A wave.
The dashed lines show the likely price range wherein wave C{-12} will end. The lower boundary, at 3773.50, would have made the C wave as long as the preceding A wave, 134.50 points. The price has already exceeded that level. The upper boundary, at 3850.93, is 165% of wave A’s length.
Once wave 4{-11} is complete, it will be followed by wave 5{-11}, the final wave of the parent wave 3{-10}, which began on June 2 from 4189. Working up the family tree, wave 3{-10} is the middle wave within wave 5{-9}, which began on May 30. The end of wave 5{-9} will also be the end of two larger waves, wave 5{-8}, which began on April 21, and wave 5{-7}, which began on March 29, and also of wave 1{-6}, which began on January 4.
After wave 1{-6} reaches completion, it will be followed by an upward correction, wave 2{-6}, whose rise will retrace a portion of the decline since early January. Corrections, of course, are classic head-fakes. Wave 2{-6} will be followed by an energetic wave 3{-6} that will carry the price down by an impressive amount.
We Are Here.
These are the waves currently in progress under my principal analysis. Each line on the list shows the wave number, with the subscript in curly brackets, the traditional degree name, the starting date, the starting price of the S&P 500 E-mini futures, and the direction of the wave.
- S&P 500 Index:
- 5{+3} Supercycle, 7/8/1932, 4.40 (up)
- 5{+2} Cycle, 12/9/1974, 60.96 (up)
- 5{+1} Primary, 3/6/2009, 666.79 (up)
- 5{0} Intermediate, 12/26/2018, 2346.58 (up)
- 4{-1} Minor, 1/4/2022 4818.62 (down)
- 1{-2} Minute, 1/4/2022 4818.62 (down)
- S&P 500 Futures and index:
- 1{-3} Minuette, 1/4/2022, 4808.25 (down) (futures), 4818.62 (down) (index)
- S&P 500 Futures:
- 1{-4} Subminuette, 1/4/2022, 4808.25 (down)
- 1{-5} Micro, 1/4/2022, 4808.25 (down)
- 1{-6} Submicro, 1/4/2022, 4808.25 (down)
- 5{-7} Minuscule, 3/29/2022, 4631 (down)
- 5{-8} Subminuscule, 4/21/2022, 4509, (down)
Learning and other resources. Elliott wave analysis provides context, not prophecy. As the 20th century semanticist Alfred Korzybski put it in his book Science and Sanity (1933), “The map is not the territory … The only usefulness of a map depends on similarity of structure between the empirical world and the map.” And I would add, in the ever-changing markets, we can judge that similarity of structure only after the fact.
See the menu page Analytical Methods for a rundown on where to go for information on Elliott wave analysis.
By Tim Bovee, Portland, Oregon, June 24, 2022
Disclaimer
Tim Bovee, Private Trader tracks the analysis and trades of a private trader for his own accounts. Nothing in this blog constitutes a recommendation to buy or sell stocks, options or any other financial instrument. The only purpose of this blog is to provide education and entertainment.
No trader is ever 100 percent successful in his or her trades. Trading in the stock and option markets is risky and uncertain. Each trader must make trading decisions for his or her own account, and take responsibility for the consequences.
License
All content on Tim Bovee, Private Trader by Timothy K. Bovee is licensed under a Creative Commons Attribution-ShareAlike 4.0 International License.
Based on a work at www.timbovee.com.

You must be logged in to post a comment.