3:30 p.m. New York time
Half an hour before the closing bell. The S&P 500 continued to decline during the morning, reaching 3741.25 on the futures and then reversing back in to the low 3800s before resuming the decline. The movement appears too small to be an immediate child wave of the downtrend that began on June 28. I’m staying with this morning’s labeling of that downtrend as wave 5{-11}. I consider it to still be in its first subwave, 1{-12}. No change in the analysis. I’ve updated the chart.
10:40 a.m. New York time
MU earnings play entry. I’ve entered a short bear call vertical spread on MU using options that trade for the last time on August 19 and have posted an analysis of the trade.
10 a.m. New York time
WBA earnings play exit. I’ve exited my short bear call spread options position on WBA for 53.8% of maximum potential profit and have updated the trade analysis with full results.
9:35 a.m. New York time
What’s happening now? The S&P 500 E-mini futures declined further overnight, into the upper 3700s.
What does it mean? The downtrend that began on June 28 continues and likely will carry the price significantly lower. It is a continuation of the larger downtrend that began on June 2
What is the alternative? The upward correction that began on June 14 from 3708.50 is still underway and is forming a compound structure. The present decline is a wave that will connect the just completed corrective pattern with a second corrective pattern.
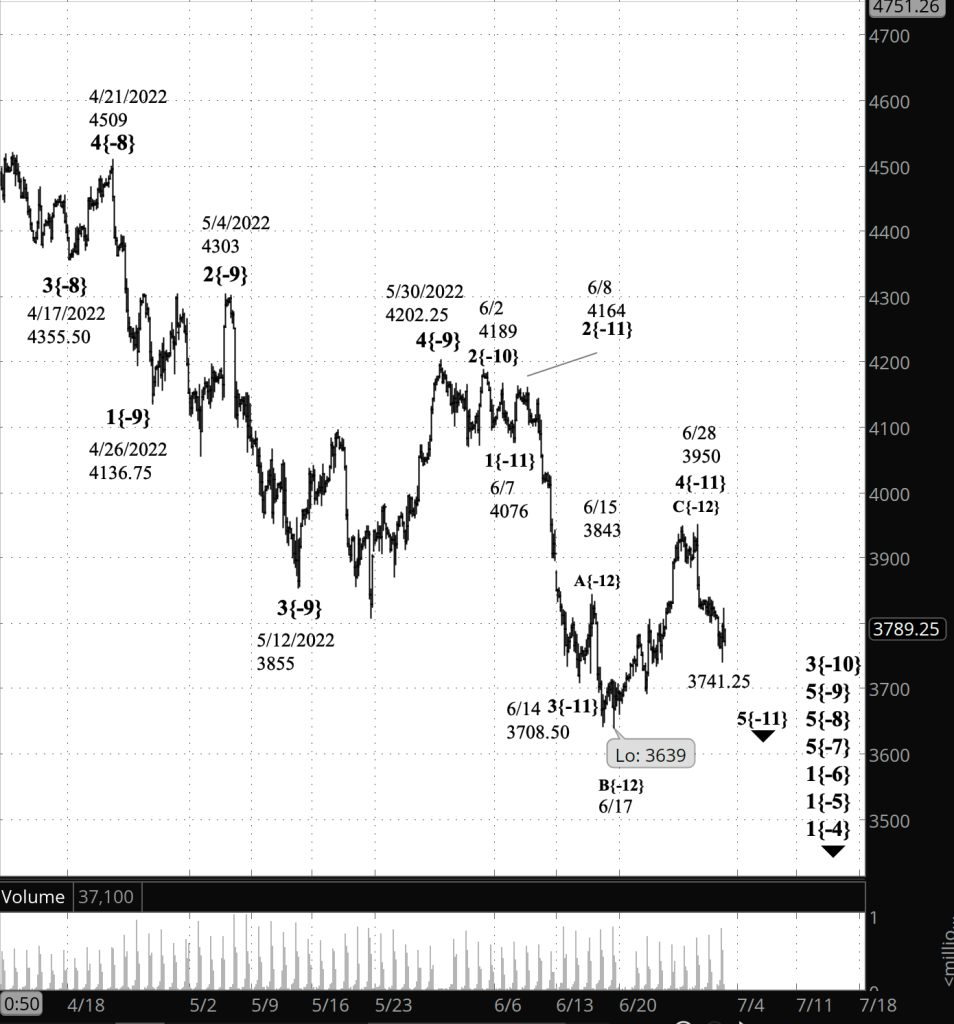
What does Elliott wave theory say? Under the principal analysis, downtrending wave 5{-11}, which began on June 28, is underway. Although it could be cut short — “truncated” is the term of art — it will most likely fall below the end of the preceding wave 3{-11}, at 3708.50 on June 16, and typically it will move lower by a significant amount.
Under the alternative analysis, the wave 4{-11} upward correction that began on June 14 has completed one corrective pattern and is now in a declining connector wave, X{-12}, which will be followed by a second corrective pattern, and perhaps by a third. Once the compound correction is over, wave 5{-11} will begin and behave as described in the principal analysis.
The end of wave 5{-11} will also be the end of its parent, wave 3{-10}, which began on June 2 from 4189. The ensuing upward correction, wave, 4{-10}. A 4th wave correction typically ends within the 4th subwave of the preceding 3rd wave. In this case, wave 4{-10} would end in the range of wave 4{-11} within wave 3{-10} — between 3639 and 3950.
Wave 5{-10} will follow, carrying the price still lower. The end of wave 5{-10} will also be the end of 5th waves up to wave 5{-7}, three degrees larger. Wave 5{-7}, in turn, will be the final wave within wave 1{-6}, which began on January 4 from 4808.25. The ensuing wave 2{-6} upward correction may well retrace a significant amount of the wave 1{-6}, although that’s a tendency, not a guarantee.
The June 28 high, 3950, is as high as the S&P 500 is likely to go over the nearer term (weeks to a few months). Over the next six months or so, the 4700s are likely to be the upper limit of the market’s rise.
The end of wave 2{-6}, however high it goes, will also be the start of wave 3{-6}, a downtrending wave with all of the power that 3rd waves tend to display. Wave 1{-6} has covered about a thousand points so far.
Wave 3{-6} can be expected to cover several multiples of its final distance, although, again, with a caveat: The rule is that a 3rd wave can’t be shorter than both the preceding 1st wave and the ensuing 5th wave. If either the 1st or the 5th wave is uncharacteristically short, then the 3rd wave could turn out to be quite short without breaking the rule.
We Are Here.
These are the waves currently in progress under my principal analysis. Each line on the list shows the wave number, with the subscript in curly brackets, the traditional degree name, the starting date, the starting price of the S&P 500 E-mini futures, and the direction of the wave.
- S&P 500 Index:
- 5{+3} Supercycle, 7/8/1932, 4.40 (up)
- 5{+2} Cycle, 12/9/1974, 60.96 (up)
- 5{+1} Primary, 3/6/2009, 666.79 (up)
- 5{0} Intermediate, 12/26/2018, 2346.58 (up)
- 4{-1} Minor, 1/4/2022 4818.62 (down)
- 1{-2} Minute, 1/4/2022 4818.62 (down)
- S&P 500 Futures and index:
- 1{-3} Minuette, 1/4/2022, 4808.25 (down) (futures), 4818.62 (down) (index)
- S&P 500 Futures:
- 1{-4} Subminuette, 1/4/2022, 4808.25 (down)
- 1{-5} Micro, 1/4/2022, 4808.25 (down)
- 1{-6} Submicro, 1/4/2022, 4808.25 (down)
- 5{-7} Minuscule, 3/29/2022, 4631 (down)
- 5{-8} Subminuscule, 4/21/2022, 4509, (down)
Learning and other resources. Elliott wave analysis provides context, not prophecy. As the 20th century semanticist Alfred Korzybski put it in his book Science and Sanity (1933), “The map is not the territory … The only usefulness of a map depends on similarity of structure between the empirical world and the map.” And I would add, in the ever-changing markets, we can judge that similarity of structure only after the fact.
See the menu page Analytical Methods for a rundown on where to go for information on Elliott wave analysis.
By Tim Bovee, Portland, Oregon, June 30, 2022
Disclaimer
Tim Bovee, Private Trader tracks the analysis and trades of a private trader for his own accounts. Nothing in this blog constitutes a recommendation to buy or sell stocks, options or any other financial instrument. The only purpose of this blog is to provide education and entertainment.
No trader is ever 100 percent successful in his or her trades. Trading in the stock and option markets is risky and uncertain. Each trader must make trading decisions for his or her own account, and take responsibility for the consequences.
License
All content on Tim Bovee, Private Trader by Timothy K. Bovee is licensed under a Creative Commons Attribution-ShareAlike 4.0 International License.
Based on a work at www.timbovee.com.

You must be logged in to post a comment.