3:30 p.m. New York time
Half an hour before the closing bell. The S&P 500 futures swiftly climbed into the mid-3900s, moving above the July 17 peak, 3909.50. As noted in this morning’s alternative analysis, a move above that level requires a re-analysis of the chart.
Under the new scenario, the first segment, wave A{-13}, of the upward correction that began on July 14, wave 4{-12}, is still underway. Internally, the A wave is in its final subwave, wave 5{-14}. Since wave A{-13} contains five internal waves, the correction is taking the form of a Zigzag. The B{-13} wave that will follow will have three internal waves and will retrace 38% to 79% of wave A{-13}. the final wave within wave Zigzag, wave C{-13}, will if it is typical be about the same length as wave A{-13}.
I’ve left this morning’s chart as it was, and marked it as outdated. I’ve added a new chart that shows the revised analysis.

10:40 a.m. New York time
HAL earnings play exit; no new positions today. I’ve exited my short bull put options spread on HAL for 17.9% of maximum potential profit, a bit below my 25% of max goal. I’ve updated the trade analysis with results.
No entries today. I have four prospects, in order of attractiveness as a trade — JBHT, MTB, PNFP and BIIB. But all were less liquid than my standards require.
9:35 a.m. New York time
What’s happening now? The S&P 500 E-mini futures reversed from yesterday’s session low, 3820.25, reaching back into the upper 3800s.
What does it mean? Yesterday’s low marked the end of the first internal wave within the declining middle leg of an upward correction that began on July 14.
What is the alternative? If the price moves above 3909.50, then yesterday’s low was a correction within the rising first leg of the upward correction.
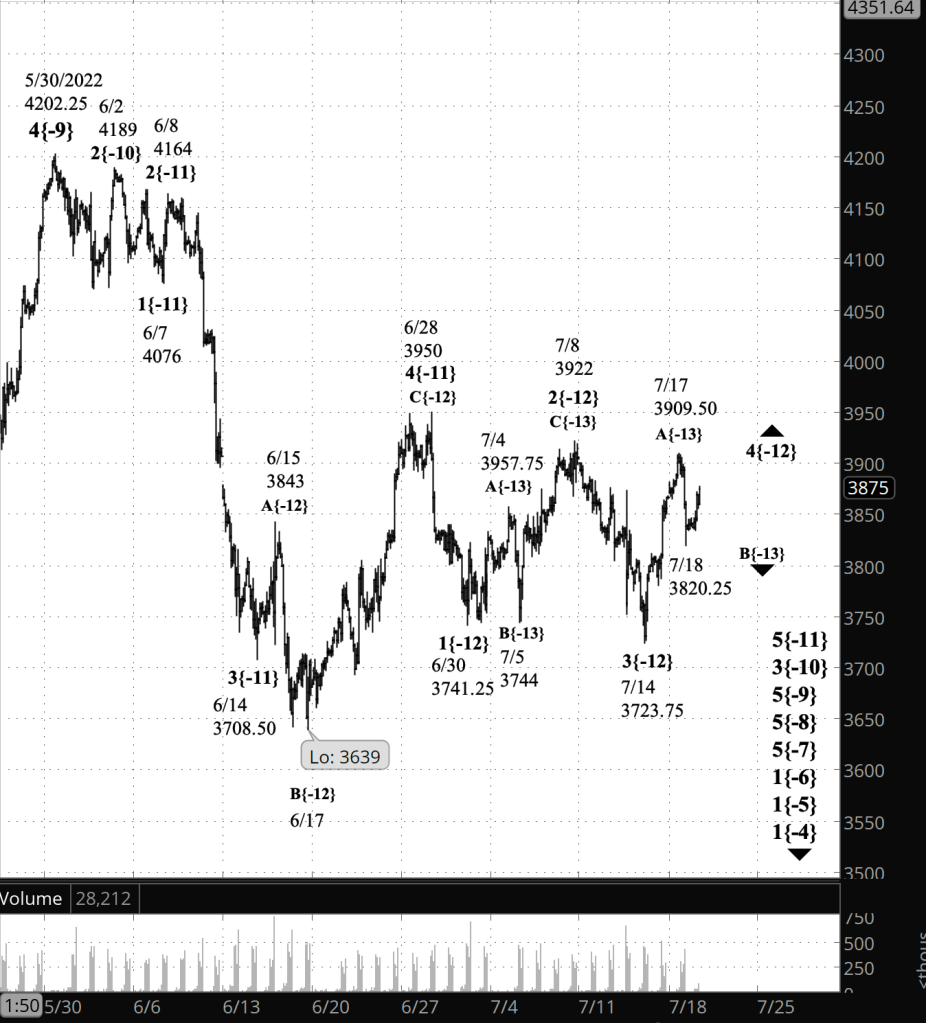
What does Elliott wave theory say? Both the principal analysis and the alternative analysis agree that wave 4{-12}, an upward correction that began on July 14 from 3723.75, is still underway. The question is what form that 4th wave is taking: A Flat, which would be most common for a 4th wave, or a Zigzag, which is more common for 2nd waves but not unheard of for 4th waves.
If the form is a Flat, as the principal analysis has it, then wave A{-13} ended on July 17 with three internal waves, and wave B{-13} began on that date, has completed the first internal wave of three, and is now in its second internal wave.
If the form is a Zigzag, as the alternative analysis has it, then wave A{-13} is still underway. The July 17 high was the end of the third internal wave of five within wave A{-13}, the subsequent decline was the fourth wave and the present rise is the fifth wave.
A Flat pattern must match these rules: The B wave always retraces at least 90% of the preceding A wave, which would carry the price down to 3742.50 or more. The price usually retraces 100% up to 138% of the A wave. At present the price is well above those levels, and a failure to reach at least 3742.50 would disqualify the Flat scenario, forcing a re-analysis.
The Zigzag scenario is still in its A-wave, and so there are little in the way of rules or guidance. A 4th wave never moves beyond the start of the preceding 1st wave, which in the case of wave 1{-12} would be 3950. If the price reverses and rises above 3950, then the Zigzag scenario is disqualified, forcing a re-analysis.
The Flat scenario seems more likely to me, but there are no guarantees that it will actually play out that way, given the ambiguities on the chart.
Wave 4{-12} is a subwave of declining wave 5{-11}, itself a subwave of declining wave 3{-10}, which in turn is a subwave of declining wave 5{-9} within downtrending wave 5{-8}. At this point the list of waves within waves picks up with the “We Are Here” list, below. Long story short: Whatever the movements within wave 4{-12}, the larger trends are down.
We Are Here.
These are the waves currently in progress under my principal analysis. Each line on the list shows the wave number, with the subscript in curly brackets, the traditional degree name, the starting date, the starting price of the S&P 500 E-mini futures, and the direction of the wave.
- S&P 500 Index:
- 5{+3} Supercycle, 7/8/1932, 4.40 (up)
- 5{+2} Cycle, 12/9/1974, 60.96 (up)
- 5{+1} Primary, 3/6/2009, 666.79 (up)
- 5{0} Intermediate, 12/26/2018, 2346.58 (up)
- 4{-1} Minor, 1/4/2022 4818.62 (down)
- 1{-2} Minute, 1/4/2022 4818.62 (down)
- S&P 500 Futures and index:
- 1{-3} Minuette, 1/4/2022, 4808.25 (down) (futures), 4818.62 (down) (index)
- S&P 500 Futures:
- 1{-4} Subminuette, 1/4/2022, 4808.25 (down)
- 1{-5} Micro, 1/4/2022, 4808.25 (down)
- 1{-6} Submicro, 1/4/2022, 4808.25 (down)
- 5{-7} Minuscule, 3/29/2022, 4631 (down)
- 5{-8} Subminuscule, 4/21/2022, 4509, (down)
Learning and other resources. Elliott wave analysis provides context, not prophecy. As the 20th century semanticist Alfred Korzybski put it in his book Science and Sanity (1933), “The map is not the territory … The only usefulness of a map depends on similarity of structure between the empirical world and the map.” And I would add, in the ever-changing markets, we can judge that similarity of structure only after the fact.
See the menu page Analytical Methods for a rundown on where to go for information on Elliott wave analysis.
By Tim Bovee, Portland, Oregon, July 19, 2022
Disclaimer
Tim Bovee, Private Trader tracks the analysis and trades of a private trader for his own accounts. Nothing in this blog constitutes a recommendation to buy or sell stocks, options or any other financial instrument. The only purpose of this blog is to provide education and entertainment.
No trader is ever 100 percent successful in his or her trades. Trading in the stock and option markets is risky and uncertain. Each trader must make trading decisions for his or her own account, and take responsibility for the consequences.
License
All content on Tim Bovee, Private Trader by Timothy K. Bovee is licensed under a Creative Commons Attribution-ShareAlike 4.0 International License.
Based on a work at www.timbovee.com.

You must be logged in to post a comment.