3:30 p.m. New York time
Half an hour before the closing bell. The S&P 500 has traded narrowly day, ranging from the 4260s to the 4290s on the futures. No change in the analysis. The uptrend that began on August 9, wave 5{-13}, continues. I’ve updated the upper chart.
9:35 a.m. New York time
What’s happening now? The S&P 500 E-mini futures traded in a narrow range overnight, between the 4260s and the 4290s, remaining below the August 16 peak, 4327.50.
What does it mean? The shallowness of the pullback — the lack of energy to the downside — suggests to me that the uptrend that began on August 9 from 4113 is still underway and that the price will push beyond the most recent peak to a higher high. Under this principal analysis, the shallow decline has been a downward correction within that uptrend.
What is the alternative? As has been the case for several days, the alternative is that the August 16 peak was the end of the uptrend that began on August 9 and the subsequent shallow decline is the first, tentative step of a downtrend.
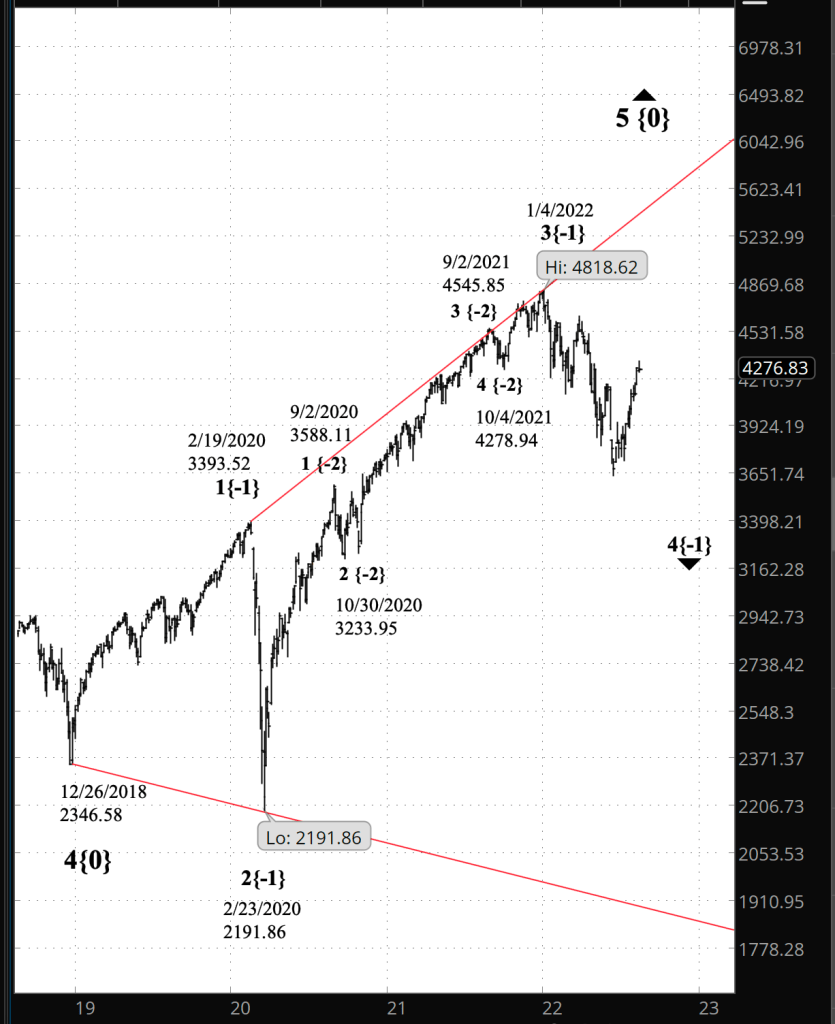
The charts. The upper chart is a close-up of the S&P 500 E-mini futures for July and August. The lower chart shows the entirety of the major bull market from December 2018 to the present.

What does Elliott wave theory say? The uptrend that began on August 9 is wave 5{-13}, the final wave of the trend within a larger uptrend, wave 5{-12}, which began on August 2 from 4080.50.
The fractal structure is in turn internal to wave 3{-11}, the middle wave of an uptrend that began on July 18 from 3920.25, which in turn is the middle subwave of a larger uptrend, wave 3{-10}, which began on July 14 from 3723.75.
When wave 5{-13} is complete — it ended on August 16 according to the alternative analysis and still has more upside to go according to the principal analysis — it will also be the end of its parent wave, 5{-12}, and also of wave 3{-11}, which is larger by one degree.
If we focus nine degrees larger, we find the market of July and August is a small portion of wave 4{-1}, a major downtrend that began on January 4 from 4818.62, which is in turn the penultimate subwave within wave 5{0}, an expanding Diagonal Triangle that is the final wave of an uptrend that began the day after Christmas, on December 26, 2018 from 2346.58 on the index, which reached a high, on August 16 at 4325.28.
What a nice Christmas present that rise of nearly 2,000 points has been for bullish traders. And when downtrending wave 4{-1} is complete, wave 5{-1} will resume that rise that began in 2018, carrying wave 5{0} to new heights.
Learning and other resources. Elliott wave analysis provides context, not prophecy. As the 20th century semanticist Alfred Korzybski put it in his book Science and Sanity (1933), “The map is not the territory … The only usefulness of a map depends on similarity of structure between the empirical world and the map.” And I would add, in the ever-changing markets, we can judge that similarity of structure only after the fact.
See the menu page Analytical Methods for a rundown on where to go for information on Elliott wave analysis.
By Tim Bovee, Portland, Oregon, August 18, 2022
Disclaimer
Tim Bovee, Private Trader tracks the analysis and trades of a private trader for his own accounts. Nothing in this blog constitutes a recommendation to buy or sell stocks, options or any other financial instrument. The only purpose of this blog is to provide education and entertainment.
No trader is ever 100 percent successful in his or her trades. Trading in the stock and option markets is risky and uncertain. Each trader must make trading decisions for his or her own account, and take responsibility for the consequences.
License
All content on Tim Bovee, Private Trader by Timothy K. Bovee is licensed under a Creative Commons Attribution-ShareAlike 4.0 International License.
Based on a work at www.timbovee.com.

You must be logged in to post a comment.