6:25 p.m. New York time
Correction. I’ve corrected paragraph 2 of the 3:30 p.m. post to clarify that wave 5{-11} likely will move above the August 16 high but will remain below the January 4 high, when a major downward movement, wave 4{-1}, began.
3:30 p.m. New York time
Half an hour before the closing bell. The S&P 500 E-mini futures having continued their decline during the session, reaching a low of 4133, a few cents below the 38.2% Fibonacci retracement level. The decline also put wave 4{-11} within the target range for a 4th wave, the range covered by wave 4{-12} in early August, within the preceding uptrend, wave 3{-11}, which ran from July 18 to August 16.
The downward correction, wave 4{-11}, is in its first internal wave, downward wave A{-12}, and if it takes the pattern of a Flat, as 4th waves tend to do, it still has two waves left before completion: Rising wave B{-12} and then downward wave C{-12}. Typically, the C wave will end the correction, and uptrending wave 5{-11} will begin its rise, most likely above the August 16 high, 4327.50, although it will remain below the January 4 high, 4808.25.
No change in the analysis. I’ve updated the chart.
9:35 a.m. New York time
What’s happening now? The S&P 500 E-mini futures continued to fall when trading resumed Sunday evening, reaching a low of 4170 shortly after the opening bell.
What does it mean? A downward correction that began on August 16 from 4237.50 is underway. So far it has retraced more than a quarter of the rise that began on July 18 from 3820.25.
What are the alternatives? The further the price falls, the less plausible the alternative analysis becomes, that the decline from August 16 is a correction within the uptrend from July 18. Less plausible falls short of impossible, so I’m keeping the alternative on the table for now.
The chart. I’ve superimposed a Fibonacci grid, in red, to provide context for the extent of the decline. So far the price has pushed beyond the 23.6% Fibonacci retracement level.
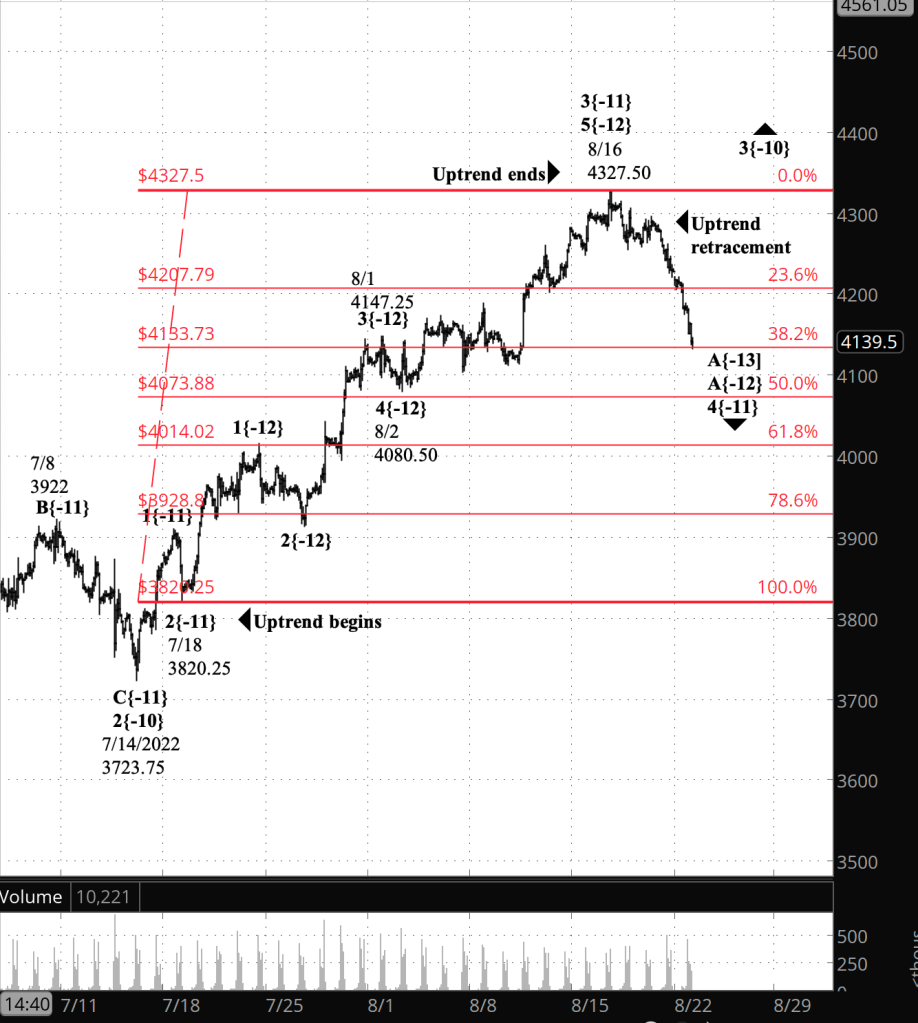
What does Elliott wave theory say? Under the principal analysis, the downward correction that began on August 16 is wave 4{-11} within a still ongoing uptrend, wave 3{-10}, which began on July 14 from 3723.75. Wave 4{-11} is retracing wave 3{-11}, which began on July 18 from 3820.25.
Internally, I count wave 4{-11} as being in the first wave, A{-13} within the larger first wave, A{-12}, of the downward correction. However, the early waves of a trend or correction are notoriously ambiguous regarding where they fit in the fractal hierarchy of Elliott wave analysis, and that is certainly the case here. “Fit in the fractal hierarchy” is a technical way of saying, “How big is this wave compared to other waves?”.
Since the correction is a 4th wave, it typically will end within the range of the 4th wave within the preceding 3rd wave, which is between the 4190s and the 4070s, a retracement between the 38.2% and 50% Fibonacci levels.
Under the alternative analysis, wave 3{-11} is continuing its rise that began on July 18.
Learning and other resources. Elliott wave analysis provides context, not prophecy. As the 20th century semanticist Alfred Korzybski put it in his book Science and Sanity (1933), “The map is not the territory … The only usefulness of a map depends on similarity of structure between the empirical world and the map.” And I would add, in the ever-changing markets, we can judge that similarity of structure only after the fact.
See the menu page Analytical Methods for a rundown on where to go for information on Elliott wave analysis.
By Tim Bovee, Portland, Oregon, August 22, 2022
Disclaimer
Tim Bovee, Private Trader tracks the analysis and trades of a private trader for his own accounts. Nothing in this blog constitutes a recommendation to buy or sell stocks, options or any other financial instrument. The only purpose of this blog is to provide education and entertainment.
No trader is ever 100 percent successful in his or her trades. Trading in the stock and option markets is risky and uncertain. Each trader must make trading decisions for his or her own account, and take responsibility for the consequences.
License
All content on Tim Bovee, Private Trader by Timothy K. Bovee is licensed under a Creative Commons Attribution-ShareAlike 4.0 International License.
Based on a work at www.timbovee.com.

You must be logged in to post a comment.