10:25 a.m. New York time
What’s happening now? The S&P 500 E-mini futures scribbled in a narrow range after trading resumed Sunday evening, fluctuating between 3915 and 3942. U.S. markets are closed today for the Labor Day holiday and will resume trading on Tuesday. This will be my only update today, unless the market breaks significantly out of that narrow range.
What does it mean? The analysis is unchanged from Friday. The downtrend that began from Friday’s peak, 4019.25, continues, having fallen more than 100 points. Under this scenario, the decline will continue when the U.S. markets re-open, reaching below 3903.50, the beginning of the upward correction, and perhaps significantly below that point.
What are the alternatives? Under another scenario, Friday’s peak was the end of the first leg of an upward correction that began on September 1, and the decline from Friday’s peak is the second leg of the ongoing correction. Under this scenario, the decline will reverse soon, taking the price back to the 4019.25, the end of the first leg of the correction, and perhaps higher.
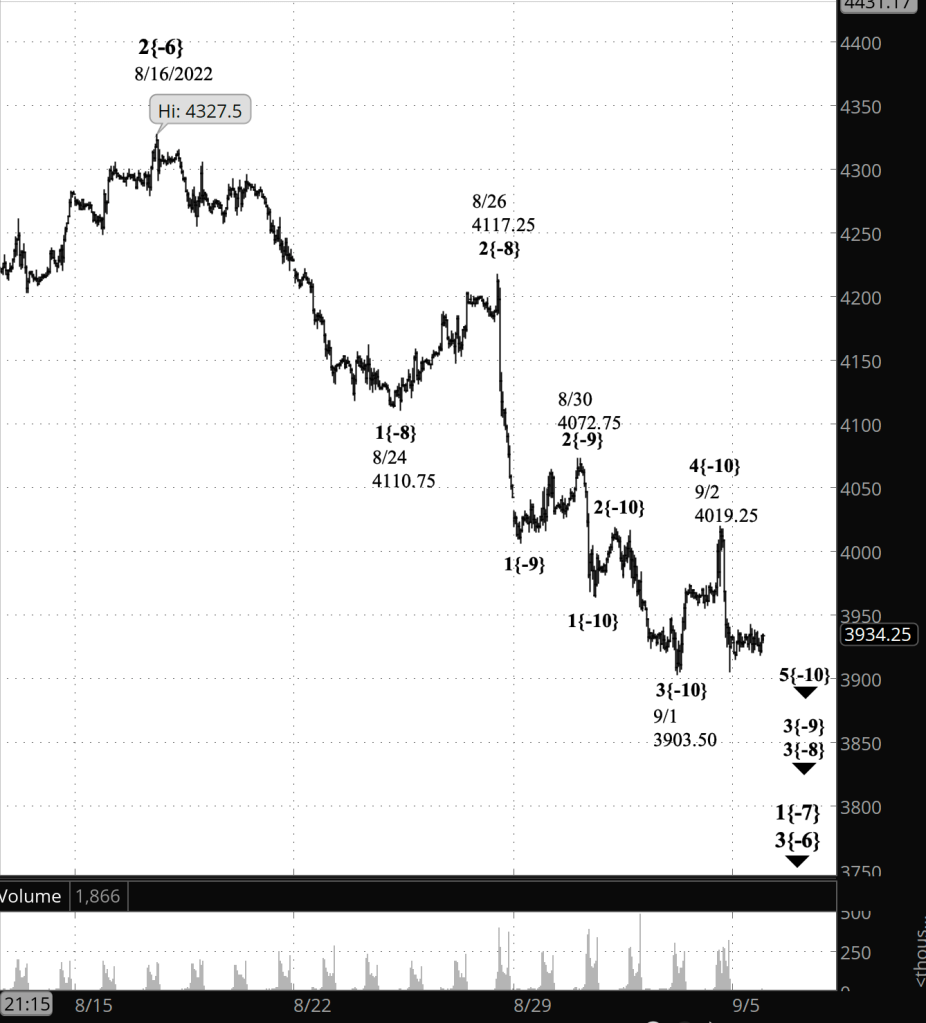
What does Elliott wave theory say? Under the principal analysis, downtrending wave 5{-10} is underway. The pause during holiday trading can be interpreted as wave 2{-11} within 5{-10}. When that 2nd wave is complete, wave 3{-11} will the price within wave 5{-10} significantly lower.
Under the alternative analysis, wave A{-11} within wave 4{-10} ended on Friday, and wave B{-11} began. Wave B{-11} can be expected to end soon, and it will be followed by wave C{-11}, which will carry the price back to Friday’s peak and perhaps higher.
This is all happening within a nested series of downtrending waves. From smaller to larger, they are wave 3{-9}, which began on August 30; wave 3{-8}, on August 26; wave 1{-7}, on August 16; and wave 3{-6}, also on August 16. The entirety of the decline that began on January 4 from 4808.25 is within wave 4{-1}, the next to the last wave in a very large expanding Diagonal Triangle, wave 5{0}, that began on December 26, 2018.
Learning and other resources. Elliott wave analysis provides context, not prophecy. As the 20th century semanticist Alfred Korzybski put it in his book Science and Sanity (1933), “The map is not the territory … The only usefulness of a map depends on similarity of structure between the empirical world and the map.” And I would add, in the ever-changing markets, we can judge that similarity of structure only after the fact.
See the menu page Analytical Methods for a rundown on where to go for information on Elliott wave analysis.
By Tim Bovee, Portland, Oregon, September 5, 2022
Disclaimer
Tim Bovee, Private Trader tracks the analysis and trades of a private trader for his own accounts. Nothing in this blog constitutes a recommendation to buy or sell stocks, options or any other financial instrument. The only purpose of this blog is to provide education and entertainment.
No trader is ever 100 percent successful in his or her trades. Trading in the stock and option markets is risky and uncertain. Each trader must make trading decisions for his or her own account, and take responsibility for the consequences.
License
All content on Tim Bovee, Private Trader by Timothy K. Bovee is licensed under a Creative Commons Attribution-ShareAlike 4.0 International License.
Based on a work at www.timbovee.com.

You must be logged in to post a comment.