3:30 p.m. New York time
Half an hour before the closing bell. The S&P 500 continued to rise during the session, reaching into the 3980s on the futures so far. The rise is sufficient to persuade me that the alternative analysis from this morning best matches the chart, and I’ve changed the wave labelings to conform.
Under the new principal analysis, an upward corrective pattern that began on September 1 is underway and has entered its 3rd and final leg.
Switching to Elliott wave terminology, wave 4{-10}, an upward correction, began on September 1. Internally, its first wave, A{-11}, ended on September 2, its second wave, B{-11}, ended on September 6, and its 3rd wave, C{-11} is now underway.
The corrective pattern is taking the form of a Flat, and in a Flat, the C wave is usually between 1 and 1.65 times the length of the preceding A wave, which is 115.75 in length. Wave C{-11} began from 3883.50, giving it a price target ranging from 3999.25 to 4074.50.
A 4th wave sometimes forms a compound structure, combing two or three corrective patterns. If that happens here, then wave C{-11} will be followed by a downward connecting wave, X{-11}, and then wave A{-11} of a second corrective pattern.
I’ve updated the chart.
9:35 a.m. New York time
What’s happening now? The S&P 500 E-mini futures rose in overnight trading into the 3020s and then reversed, declining into the 3890s, afterward rising slightly.
What does it mean? The downtrend that began on September 2 continues.
What are the alternatives? The upward correction that began on September 1 continues.
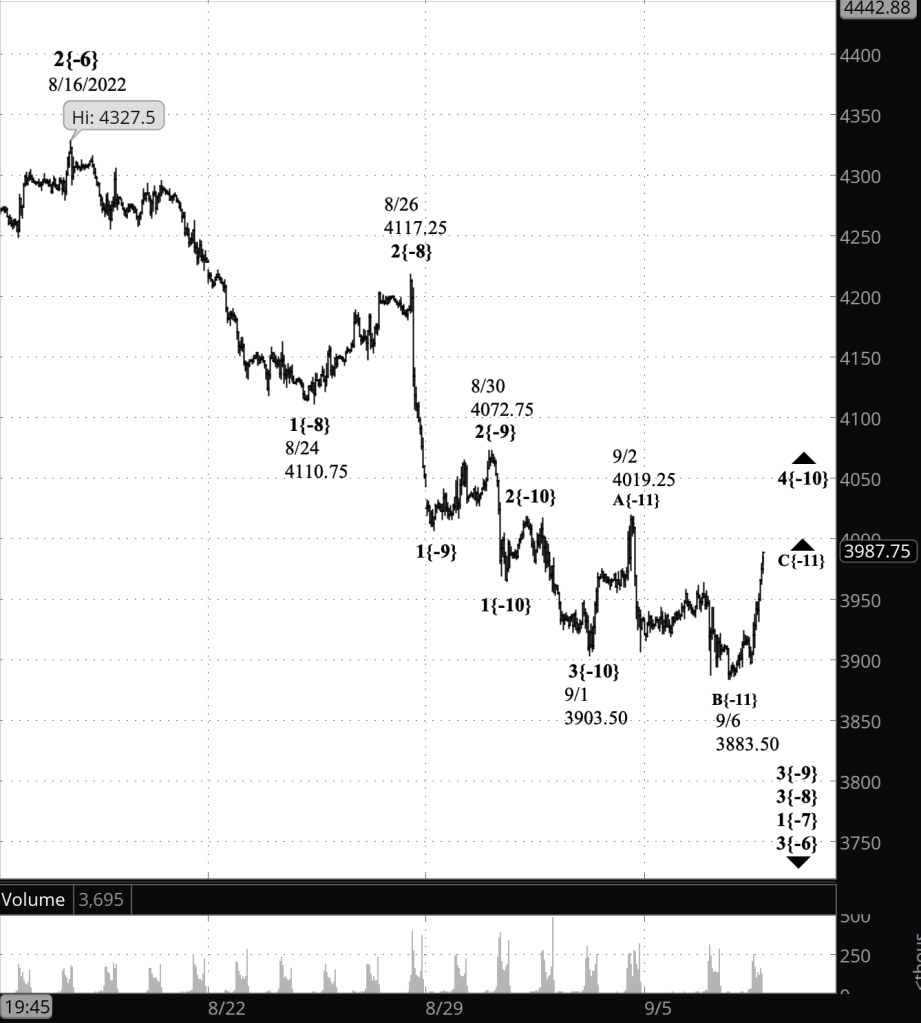
What does Elliott wave theory say? Under the principal analysis, the S&P 500s position since September 2 has been in downtrending wave 5{-10} the final wave within a larger downtrend, wave 3{-9}, which began on August 30. Under this scenario, the price will continue to decline, perhaps significantly.
Under the alternative analysis, the S&P 500 is in wave B{-11}, the middle wave of an upward corrective pattern that began on September 1, wave 4{-10}. Under this scenario, the price will reverse soon and as wave C{-11}, will rise toward the end of the preceding wave, A{-11}, and perhaps will exceed that price, 4019.25.
The further the price drops, the less likely the alternative analysis becomes.
Learning and other resources. Elliott wave analysis provides context, not prophecy. As the 20th century semanticist Alfred Korzybski put it in his book Science and Sanity (1933), “The map is not the territory … The only usefulness of a map depends on similarity of structure between the empirical world and the map.” And I would add, in the ever-changing markets, we can judge that similarity of structure only after the fact.
See the menu page Analytical Methods for a rundown on where to go for information on Elliott wave analysis.
By Tim Bovee, Portland, Oregon, September 7, 2022
Disclaimer
Tim Bovee, Private Trader tracks the analysis and trades of a private trader for his own accounts. Nothing in this blog constitutes a recommendation to buy or sell stocks, options or any other financial instrument. The only purpose of this blog is to provide education and entertainment.
No trader is ever 100 percent successful in his or her trades. Trading in the stock and option markets is risky and uncertain. Each trader must make trading decisions for his or her own account, and take responsibility for the consequences.
License
All content on Tim Bovee, Private Trader by Timothy K. Bovee is licensed under a Creative Commons Attribution-ShareAlike 4.0 International License.
Based on a work at www.timbovee.com.

You must be logged in to post a comment.