3:30 p.m. New York time
Half an hour before the closing bell. The S&P 500 fell further during the session, to 3600 on the futures, and the rose back to the 3650s. The downtrend that began on October 5 continues and is now in its next-to-the-last leg, an upward correction that will be followed by a further decline.
In Elliott wave terminology, downtrending wave 5{-9} is still underway and internally, is in wave 4{-10}, an upward correction. A 4th wave generally has three waves internally. I see it as being in its middle wave, B{-11}. True, the price has gone below the starting point of wave 4{-10}, but that’s not uncommon for 4th waves. By this analysis, the rise that followed the session low is either a subwave of wave B{-11}, or the start of the final wave, C{-11}.
Alternatively, if the price falls further to a noticeable extent, then wave 4{-10} ended at this morning’s high, 3667.50, and wave 5{-10}, the final wave within wave 5{-9} has begun.
I’ve updated the chart.
10:10 a.m. New York time
CORRECTION: In this morning’s post and also in Friday’s, I erroneously said that U.S. markets will be closed on Monday — today — for a holiday. The bond markets will be closed, but the stock markets are open.
9:35 a.m. New York time
What’s happening now? The S&P 500 E-mini futures gapped 22 points below Friday’s close when trading resumed Sunday night, opening at 3628.76. The price pushed a bit lower to 3618 and then reversed, rising back into the 3660s.
U.S. bond markets are closed today for a holiday, variously called Indigenous People’s Day or Columbus Day, depending upon which part of the country is doing the naming. The stock markets will be open. (This corrects an earlier post that said the stock market would be closed.)
What does it mean? The middle leg has ended within a downtrend that began on October 5 from 3820, and a small upward correction has begun. When the correction is complete, then the final leg of the downtrend will carry the price further down.
The price target, based on the price channel, shown in red on the chart, would be in the low 3500s. However, market movements don’t always stay within the price channels, so the price target is a maybe, not a certainty.
What are the alternatives? I’ve counted the upward correction as being one level down from the full downtrend. It’s possible to count it as being one level smaller, making it a correction within the middle leg of the downtrend.
I think the principal analysis is more likely because of how close the price has come to the lower boundary of the price channel. The alternative analysis gives more room for the downtrend to continue, and that would carry the price noticeably beyond the channel’s lower boundary.
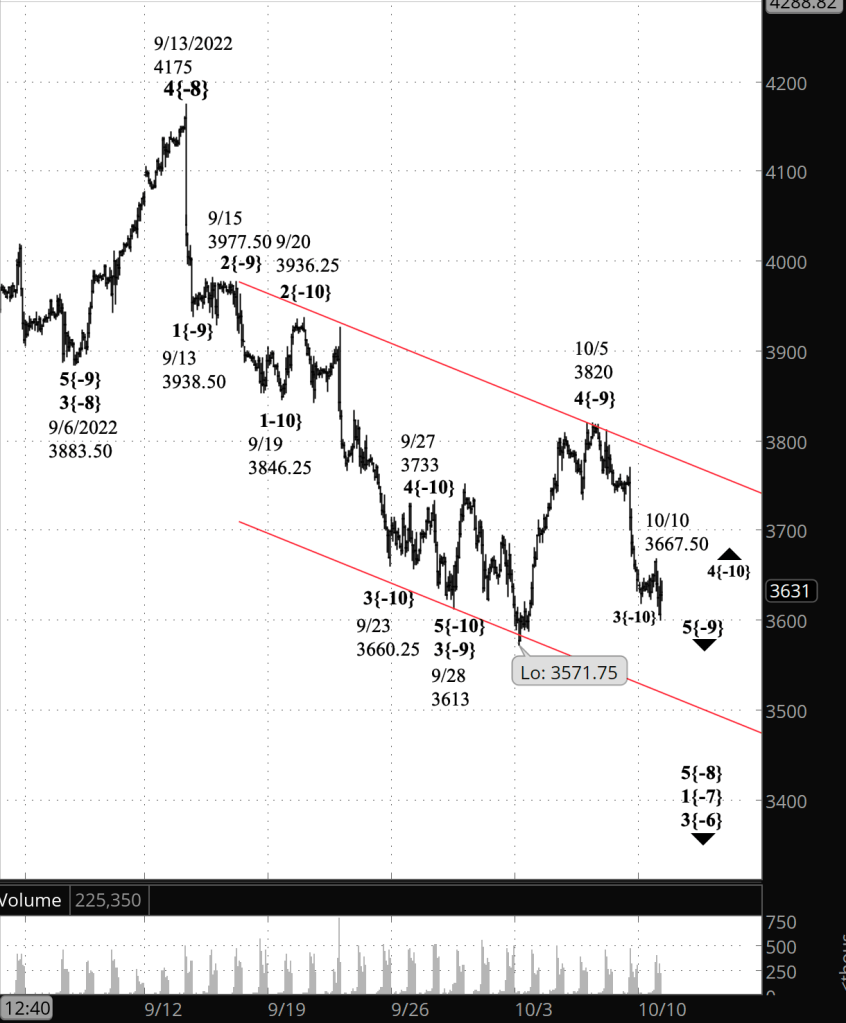
What does Elliott wave theory say? The downtrend is wave 5{-9}, and the upward correction, under my principal analysis, is wave 4{-10}. Fourth waves usually have three subwaves, and the second subwave can move below the starting point of the correction –3618 in this case — without triggering a re-analysis.
Under the alternative analysis, the upward correction is wave 4{-11} within wave 3{-10}, which in turn is a subwave of wave 5{-9}.
In either case, the end of wave 5{-9} will also be the end of its parent wave, 5{-8}, which began on September 13 from 4175, and the start of an much larger upward correction, wave 2{-7}, correcting wave 1{-7}, which began on August 16 from 4327.50.
We Are Here.
These are the waves currently in progress under my principal analysis. Each line on the list shows the wave number, with the subscript in curly brackets, the traditional degree name, the starting date, the starting price of the S&P 500 E-mini futures, and the direction of the wave.
- S&P 500 Index:
- 5{+3} Supercycle, 7/8/1932, 4.40 (up)
- 5{+2} Cycle, 12/9/1974, 60.96 (up)
- 5{+1} Primary, 3/6/2009, 666.79 (up)
- 5{0} Intermediate, 12/26/2018, 2346.58 (up)
- 4{-1} Minor, 1/4/2022 4818.62 (down)
- 1{-2} Minute, 1/4/2022 4818.62 (down)
- S&P 500 Futures and index:
- 1{-3} Minuette, 1/4/2022, 4808.25 (down) (futures), 4818.62 (down) (index)
- S&P 500 Futures:
- 1{-4} Subminuette, 1/4/2022, 4808.25 (down)
- 1{-5} Micro, 1/4/2022, 4808.25 (down)
- 3{-6} Submicro, 8/16/2022, 4327.50 (down)
- 1{-7} Minuscule, 8/16/2022, 4327.50 (down)
- 5{-8} Subminuscule, 9/13/2022, 4175 (down)
Learning and other resources. Elliott wave analysis provides context, not prophecy. As the 20th century semanticist Alfred Korzybski put it in his book Science and Sanity (1933), “The map is not the territory … The only usefulness of a map depends on similarity of structure between the empirical world and the map.” And I would add, in the ever-changing markets, we can judge that similarity of structure only after the fact.
See the menu page Analytical Methods for a rundown on where to go for information on Elliott wave analysis.
By Tim Bovee, Portland, Oregon, October 10, 2022
Disclaimer
Tim Bovee, Private Trader tracks the analysis and trades of a private trader for his own accounts. Nothing in this blog constitutes a recommendation to buy or sell stocks, options or any other financial instrument. The only purpose of this blog is to provide education and entertainment.
No trader is ever 100 percent successful in his or her trades. Trading in the stock and option markets is risky and uncertain. Each trader must make trading decisions for his or her own account, and take responsibility for the consequences.
License
All content on Tim Bovee, Private Trader by Timothy K. Bovee is licensed under a Creative Commons Attribution-ShareAlike 4.0 International License.
Based on a work at www.timbovee.com.

You must be logged in to post a comment.