3:30 p.m. New York time
Half an hour before the closing bell. The S&P 500 futures have continued to trade narrowly during the session, centering on 3600. No change in the analysis. I’ve updated the chart.
1:55 p.m. New York time
DAL earnings play entry. I’ve entered a bear call spread on DAL, using options that trade for the last time on November 18, and have posted an analysis of the trade.
9:35 a.m. New York time
What’s happening now? The S&P 500 E-mini futures traded sideways in a narrow range overnight.
What does it mean? A low-level upward correction within a downtrend continues.
What are the alternatives? The upward correction ended yesterday and the final decline within the downtrend has begun.
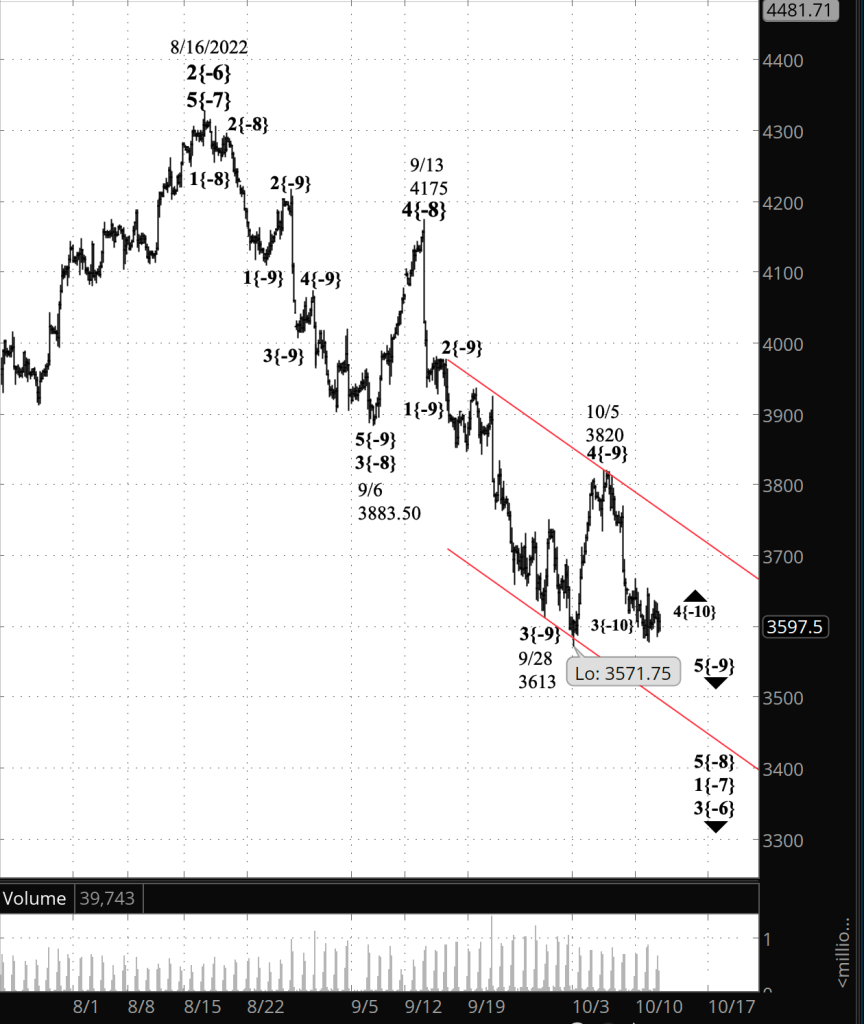
What does Elliott wave theory say? The upward correction is wave 4{-10} within wave 5{-9}, a downtrend that began on October 5 from 3820. At this point analysts are playing “Where’s Waldo” with the endpoint of wave 4{-10}. Is the correction over already or does it still underway? The difference between the principal analysis and the alternative analysis focuses on that question.
Ultimately, the question is fairly unimportant to trader’s. Wave 4{-10} is of a low degree. What we do know is that it will end soon and will be followed by a resumption of the downtrend: Wave 5{-10}, the final wave within downtrending wave 5{-9}.
When wave 5{-10} is complete, it will also be the end of its parent, wave 5{-9}, and also of two larger encompassing declines: Wave 5{-8}, which began on September 13 from 4175, and wave 1{-7}, which began on August 16 from 4327.50.
I’ve widened the view on the chart to show the entirety of the wave 1{-7} decline from August 16.
The price channel suggests that wave 5{-9} will decline to the lower boundary, a goal that is at 3500 this morning and which continually declines further. The channel is marked in red on the chart. It provides an estimate of the downside potential of wave 5{-9}, along with waves 5{-8} and 1{-7}.
Of course, 5th waves are like stubborn mules. Sometimes they come to a sudden halt before reaching the goal, and sometimes they leap forward beyond the goal.
What is certain is that waves 5{-9}, 5{-8} and 1{-7}, upon reaching their simultaneous end, will be followed by wave 2{-7}, an upward correction of far larger size than the present wave 4{-10} that, if it behaves typically in the degree of retracement, could carry the price back up to a range between 3900 and 4020, more or less. No guarantees, of course. Waves don’t always behave typically.
Wave 2{-7}, when complete, will be followed by a powerful decline, wave 3{-7}, which will carry the price well below 3500.
Wave 1{-7} began about two months ago, and wave 3{-7}, following the upward correction, may well last twice that amount of time, given the power of 3rd waves. So while the wave 2{-7} upward correction may provide some short-term bullish trading opportunities, for my own trading I plan to focus intently on the larger downtrend that will follow.
We Are Here.
These are the waves currently in progress under my principal analysis. Each line on the list shows the wave number, with the subscript in curly brackets, the traditional degree name, the starting date, the starting price of the S&P 500 E-mini futures, and the direction of the wave.
- S&P 500 Index:
- 5{+3} Supercycle, 7/8/1932, 4.40 (up)
- 5{+2} Cycle, 12/9/1974, 60.96 (up)
- 5{+1} Primary, 3/6/2009, 666.79 (up)
- 5{0} Intermediate, 12/26/2018, 2346.58 (up)
- 4{-1} Minor, 1/4/2022 4818.62 (down)
- 1{-2} Minute, 1/4/2022 4818.62 (down)
- S&P 500 Futures and index:
- 1{-3} Minuette, 1/4/2022, 4808.25 (down) (futures), 4818.62 (down) (index)
- S&P 500 Futures:
- 1{-4} Subminuette, 1/4/2022, 4808.25 (down)
- 1{-5} Micro, 1/4/2022, 4808.25 (down)
- 3{-6} Submicro, 8/16/2022, 4327.50 (down)
- 1{-7} Minuscule, 8/16/2022, 4327.50 (down)
- 5{-8} Subminuscule, 9/13/2022, 4175 (down)
Learning and other resources. Elliott wave analysis provides context, not prophecy. As the 20th century semanticist Alfred Korzybski put it in his book Science and Sanity (1933), “The map is not the territory … The only usefulness of a map depends on similarity of structure between the empirical world and the map.” And I would add, in the ever-changing markets, we can judge that similarity of structure only after the fact.
See the menu page Analytical Methods for a rundown on where to go for information on Elliott wave analysis.
By Tim Bovee, Portland, Oregon, October 12, 2022
Disclaimer
Tim Bovee, Private Trader tracks the analysis and trades of a private trader for his own accounts. Nothing in this blog constitutes a recommendation to buy or sell stocks, options or any other financial instrument. The only purpose of this blog is to provide education and entertainment.
No trader is ever 100 percent successful in his or her trades. Trading in the stock and option markets is risky and uncertain. Each trader must make trading decisions for his or her own account, and take responsibility for the consequences.
License
All content on Tim Bovee, Private Trader by Timothy K. Bovee is licensed under a Creative Commons Attribution-ShareAlike 4.0 International License.
Based on a work at www.timbovee.com.

You must be logged in to post a comment.