3:30 p.m. New York time
Half an hour before the closing bell. The S&P 500 continued to trade sideways during the day. No change from the morning analysis. An upward correction, wave 2{-7} continues. Internally, it is in wave D{-9} within the corrections first wave, A{-8}. I’ve updated the chart.
1:45 p.m. New York time
IBM earnings play entry. I’ve entered a short bear call spread on IBM, using options that trade for the last time on November 4, and have posted an analysis of the trade.
1:15 p.m. New York time
UAL and ABT earnings play exits. I’ve exited my short bull put options spreads on UAL, for a profit, and ABT, for a loss, and have updated their trade analyses with results, linked to as follows: UAL, ABT.
9:35 a.m. New York time
What’s happening now? The S&P 500 E-mini futures fluctuated across a narrow range overnight, from the 3690s to the 3770s.
What does it mean? The sideways movement is clearly a correction. Given the movement’s size, I view as it as the declining fourth segment within the first leg of an upward correction that began on October 13.
What are the alternatives? The sideways movement could also be a correction within the rising third segment within the correction.
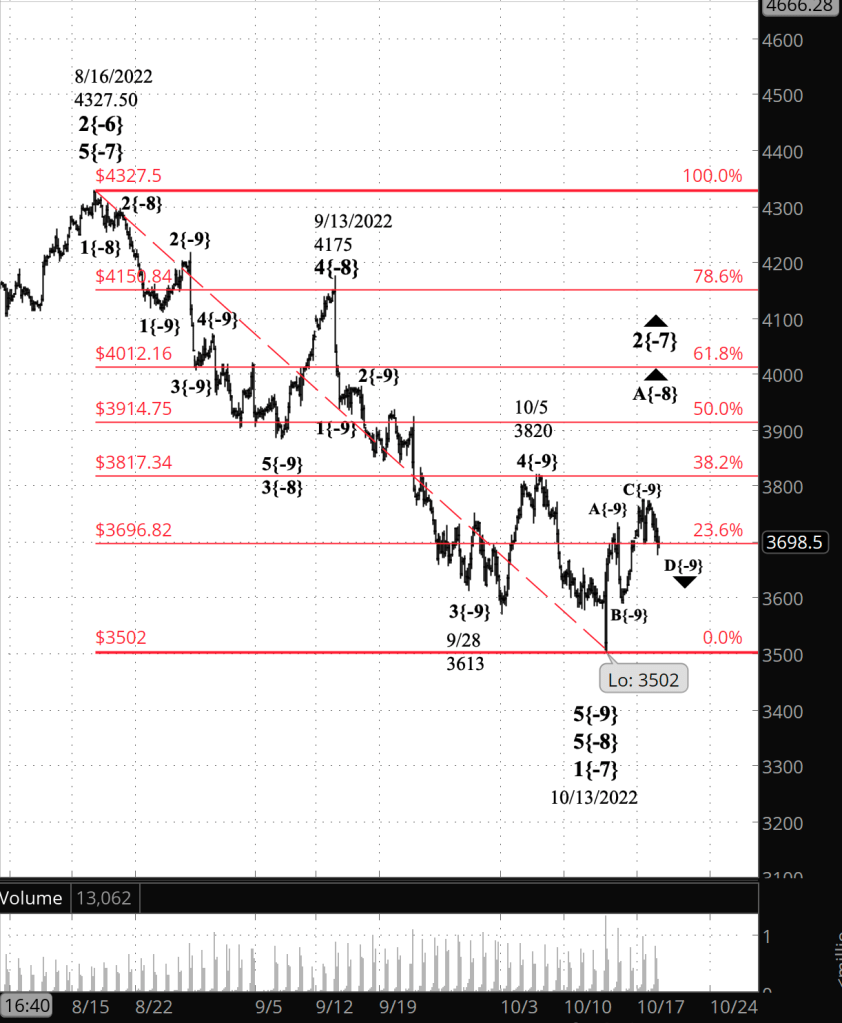
What does Elliott wave theory say? Under the principal analysis, the overnight fluctuations are wave D{-9}, the fourth wave within wave A{-8}, the first wave of a three-wave upward correction, wave 2{-7}, that began on October 13.
The presence of a fourth wave within wave A{-8} means that the correction is taking the form of a Zigzag, which is commonly seen within 2nd waves. Zigzags tend to correct a large part of the distance covered by the preceding wave, downtrending wave 1{-7}.
In this case, wave 1{-7} began from 4327.50 and ended at 3502, a distance of 825.50. Retracements sometimes will end at a Fibonacci level, and I’ve superimposed a Fibonacci ladder over the chart, in red, to help me visualize where wave 2{-7}’s endpoints might be.
Two major Fibonacci points above the 50% level are 61.8%, at 4012.16, and 78.6%, at 4150.84. A 61.8% retracement would be business as usual, and a 78.6% retracement would be something to cheer about.
Under the patterns identified in Elliott wave theory, wave 2{-7} can rise as far as wave 1{-7}’s starting point –4327.50 — but no further. That 100% retracement would count as not unheard of but extraordinary all the same.
Under the alternative analysis, the overnight fluctuations are a correction within wave C{-8}, at the {-10} degree. This scenario leaves the nature of wave 2{-7} — Zigzag or Flat — as yet undecided. It matters because Flats, as the name implies, don’t normally retrace as much territory as Zigzags do.
Wave 2{-7} is happening within wave 1{-6}, which began on August 16, within a series of nested downtrending wave up to wave 1{-2}, which began on January 4.
Wave 1{-2}’s parent is declining wave 4{-1}, part of an expanding Diagonal Triangle, wave 5{0}, that began on December 26, 2018. For reference, the 2020 market crash early in the pandemic was wave 2{-1}, and the subsequent rise that began on February 23, 2020 and ended on January 4, 2022 was wave 3{-1}.
After wave 4{-1} is complete, rising wave 5{-1} carry the price above the January 4 peak, 4818.62 on the S&P 500 index, completing the Triangle. What follows will be a downtrend of major proportions — something for the history books — that probably will take decades to complete.
We Are Here.
These are the waves currently in progress under my principal analysis. Each line on the list shows the wave number, with the subscript in curly brackets, the traditional degree name, the starting date, the starting price of the S&P 500 E-mini futures, and the direction of the wave.
- S&P 500 Index:
- 3{+4} Grand Supercycle, 1780s or 1790s, price unknown (up)
- 5{+3} Supercycle, 7/8/1932, 4.40 (up)
- 5{+2} Cycle, 12/9/1974, 60.96 (up)
- 5{+1} Primary, 3/6/2009, 666.79 (up)
- 5{0} Intermediate, 12/26/2018, 2346.58 (up)
- 4{-1} Minor, 1/4/2022 4818.62 (down)
- 1{-2} Minute, 1/4/2022 4818.62 (down)
- S&P 500 Futures and index:
- 1{-3} Minuette, 1/4/2022, 4808.25 (down) (futures), 4818.62 (down) (index)
- S&P 500 Futures:
- 1{-4} Subminuette, 1/4/2022, 4808.25 (down)
- 1{-5} Micro, 1/4/2022, 4808.25 (down)
- 3{-6} Submicro, 8/16/2022, 4327.50 (down)
- 2{-7} Minuscule, 10/13/2022, 3502 (up)
- A{-8} Subminuscule, 10/13/2022, 3502 (up)
Learning and other resources. Elliott wave analysis provides context, not prophecy. As the 20th century semanticist Alfred Korzybski put it in his book Science and Sanity (1933), “The map is not the territory … The only usefulness of a map depends on similarity of structure between the empirical world and the map.” And I would add, in the ever-changing markets, we can judge that similarity of structure only after the fact.
See the menu page Analytical Methods for a rundown on where to go for information on Elliott wave analysis.
By Tim Bovee, Portland, Oregon, October 18, 2022
Disclaimer
Tim Bovee, Private Trader tracks the analysis and trades of a private trader for his own accounts. Nothing in this blog constitutes a recommendation to buy or sell stocks, options or any other financial instrument. The only purpose of this blog is to provide education and entertainment.
No trader is ever 100 percent successful in his or her trades. Trading in the stock and option markets is risky and uncertain. Each trader must make trading decisions for his or her own account, and take responsibility for the consequences.
License
All content on Tim Bovee, Private Trader by Timothy K. Bovee is licensed under a Creative Commons Attribution-ShareAlike 4.0 International License.
Based on a work at www.timbovee.com.

You must be logged in to post a comment.