3:30 p.m. New York time
Half an hour before the closing bell. The S&P 500 futures rose during the session, moving past the 38.2% Fibonacci retracement level, to a high today of 3822 so far, and peaking above the overnight low. No change in the analysis. I’ve updated the upper chart, showing the futures from last August to the present.
9:35 a.m. New York time
What’s happening now? The S&P 500 E-mini futures rose after trading resumed overnight, reaching 3813.25 before pulling back and then beginning a second upward trip.
What does it mean? The overnight rise carried the price to the 38.2% Fibonacci retracement level, ending the middle wave of a five-wave rise. The second rise is the final wave in the series. This is happening within the initial wave of an upward correction that began on October 13 from 3502. (The Fibonacci ladder is on the futures chart, in red.)
What are the alternatives? The second rise could be part of a pullback between the middle and final waves of the series. Under this scenario, the final wave has not yet begun.
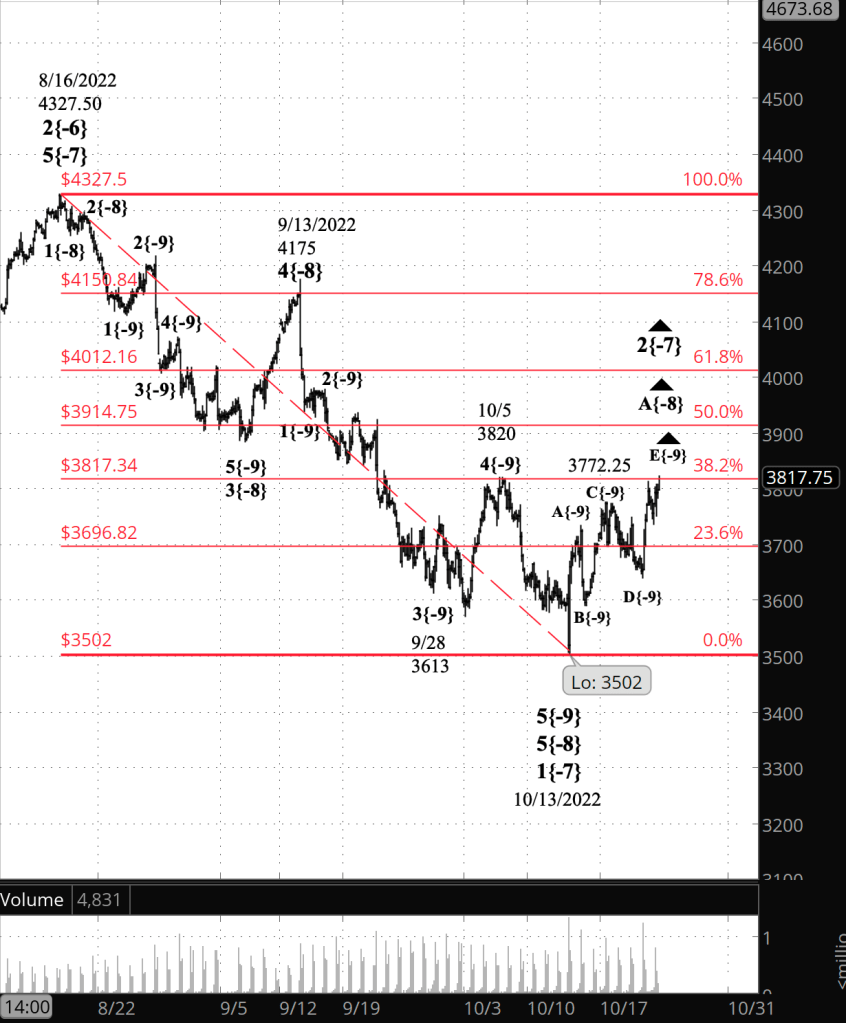
What does Elliott wave theory say? Under the principal analysis, the overnight peak was the end of wave C{-10}, the middle wave within wave E{-9}, the final wave of the initial wave, A{-8} within an upward correction, wave 2{-7}. The subsequent decline was declining wave D{-10}, and the rise that followed, wave E{-10}, which is still underway.
Under the alternative analysis, the subsequent decline was wave D{-10}, as in the principal analysis, but it is only the first wave within D{-10}. The rise that followed is the second wave within wave D{-10}, with one more declining wave to needed to carry wave D{-10} to completion.
Wave 2{-7}’s parent wave is downtrending wave 3{-6}, the subwave of a series of nested first waves ranging in degree from the smallest, wave 1{-5}, to the largest, wave 1{-2}. The series are subwaves of wave 4{-1}, the next-to-the-last wave within wave, 5{-0}, an expanding diagonal triangle that began on December 26, 2018.

We Are Here.
These are the waves currently in progress under my principal analysis. Each line on the list shows the wave number, with the subscript in curly brackets, the traditional degree name, the starting date, the starting price of the S&P 500 E-mini futures, and the direction of the wave.
- S&P 500 Index:
- 5{+3} Supercycle, 7/8/1932, 4.40 (up)
- 5{+2} Cycle, 12/9/1974, 60.96 (up)
- 5{+1} Primary, 3/6/2009, 666.79 (up)
- 5{0} Intermediate, 12/26/2018, 2346.58 (up)
- 4{-1} Minor, 1/4/2022 4818.62 (down)
- 1{-2} Minute, 1/4/2022 4818.62 (down)
- S&P 500 Futures and index:
- 1{-3} Minuette, 1/4/2022, 4808.25 (down) (futures), 4818.62 (down) (index)
- S&P 500 Futures:
- 1{-4} Subminuette, 1/4/2022, 4808.25 (down)
- 1{-5} Micro, 1/4/2022, 4808.25 (down)
- 3{-6} Submicro, 8/16/2022, 4327.50 (down)
- 2{-7} Minuscule, 10/13/2022, 3502 (up)
- A{-8} Subminuscule, 10/13/2022, 3502 (up)
Learning and other resources. Elliott wave analysis provides context, not prophecy. As the 20th century semanticist Alfred Korzybski put it in his book Science and Sanity (1933), “The map is not the territory … The only usefulness of a map depends on similarity of structure between the empirical world and the map.” And I would add, in the ever-changing markets, we can judge that similarity of structure only after the fact.
See the menu page Analytical Methods for a rundown on where to go for information on Elliott wave analysis.
By Tim Bovee, Portland, Oregon, October 24, 2022
Disclaimer
Tim Bovee, Private Trader tracks the analysis and trades of a private trader for his own accounts. Nothing in this blog constitutes a recommendation to buy or sell stocks, options or any other financial instrument. The only purpose of this blog is to provide education and entertainment.
No trader is ever 100 percent successful in his or her trades. Trading in the stock and option markets is risky and uncertain. Each trader must make trading decisions for his or her own account, and take responsibility for the consequences.
License
All content on Tim Bovee, Private Trader by Timothy K. Bovee is licensed under a Creative Commons Attribution-ShareAlike 4.0 International License.
Based on a work at www.timbovee.com.

You must be logged in to post a comment.