3:30 p.m. New York time
Half an hour before the closing bell. The S&P 500 peaked during the session at 3897.50 on the futures and then pulled back. The entire session so far has been spent between the 38.2% and 50% Fibonacci retracement levels. No changes in this morning’s analysis. Wave A{-8} within wave 2{-7} is underway. I’ve updated the chart.
1:50 p.m. New York time
BA earnings play exit. I’ve exited my short bear call options spread on BA for 2.5% of maximum expected profit and have updated the trade analysis with full results.
9:35 a.m. New York time
What’s happening now? The S&P 500 E-mini futures rose in overnight trading, to 3854, and then withdrew, remaining above the 38.2% Fibonacci retracement level.
What does it mean? The final segment of the rising first wave of an upward correction that began on October 13 continues. The decline from the overnight peak is a correction within that rising final segment. A reversal to the upside and a price movement above 3854 confirms this principal scenario.
What are the alternatives? At this point, any fresh high could mark the start of the declining middle wave. If the overnight high was that starting point, then the first segment within the middle wave of the correction is underway. The lower the price falls, the more likely this alternative scenario becomes.
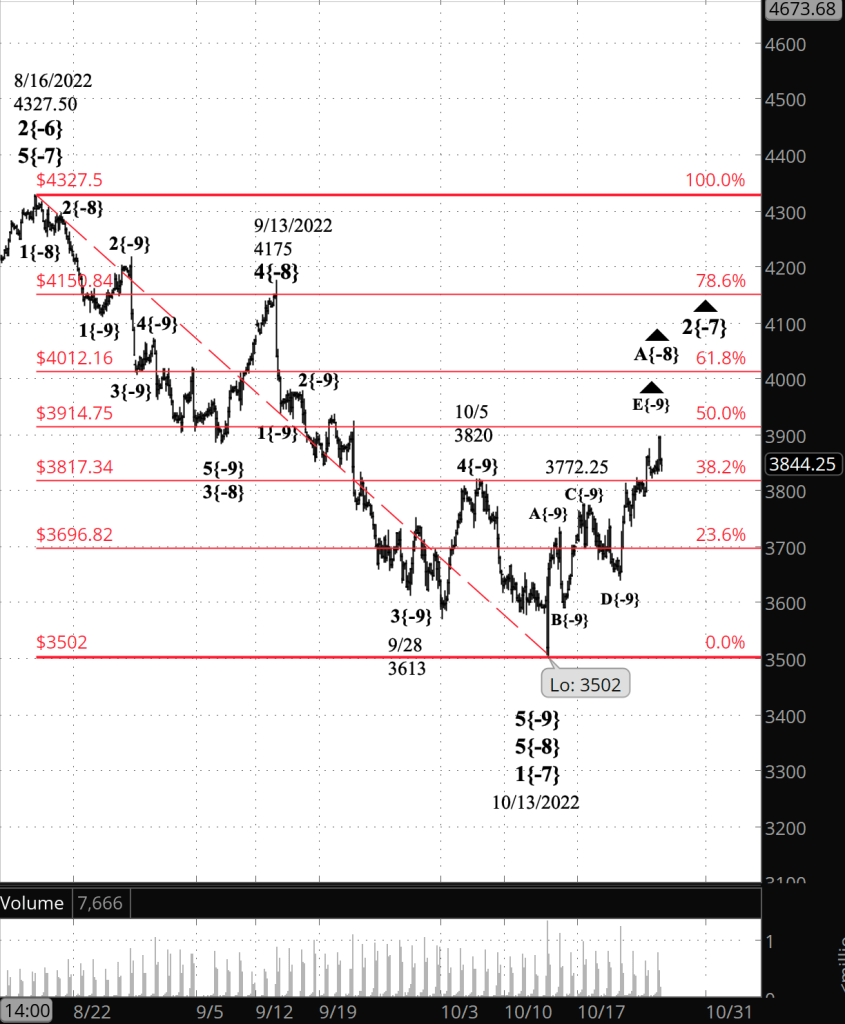
What does Elliott wave theory say? An upward correction, wave 2{-7}, began on October 13 from 3502 and is not yet complete.
The principal analysis and the alternative differ on what’s happening within wave 2{-7}. Under the principal analysis, wave E{-9} within wave A{-8} — both rising waves — are underway. Under the alternative analysis, wave A{-8} ended at the overnight high, 3854, and downward wave B{-8} has begun. It is presently its first subwave, declining wave A{-9}.
The correction is taking the form of a Zigzag, and so if the overnight high was the end of wave A{-8}, then wave B{-8} can be expected to retrace somewhere between 38% to 79% of the preceding A wave, putting the range within which it will end between 3720.24 and 3575.92. Wave B{-8} will remain above the start of wave A{-8}, from 3502. If wave B{-8} does fall belong that level, then the analysis no longer matches the chart and must be redone.
Wave 2{-7} will have three waves within it, one degree down, unless it forms a compound correction containing two or three corrective patterns. When complete, the correction will be followed by wave 3{-7}, an energetic downtrend that will fall below 3502, where the preceding 2nd wave began, and most likely significantly below that level.
This is all happening within wave 3{-6}, a downtrend that began on August 16 from 4327.50. Wave 3{-6} is part of wave 1{-5}, which is part of a series 1st waves of increasing size, the smaller embedded withint the larger, reaching up to wave 1{-2}, a subwave of wave 4{-1}, all of which began on January 4 from 4808.25. Enclosing them all is wave 5{0}, an expanding Diagonal Triangle that began on December 26, 2018.
We Are Here.
These are the waves currently in progress under my principal analysis. Each line on the list shows the wave number, with the subscript in curly brackets, the traditional degree name, the starting date, the starting price of the S&P 500 E-mini futures, and the direction of the wave.
- S&P 500 Index:
- 5{+3} Supercycle, 7/8/1932, 4.40 (up)
- 5{+2} Cycle, 12/9/1974, 60.96 (up)
- 5{+1} Primary, 3/6/2009, 666.79 (up)
- 5{0} Intermediate, 12/26/2018, 2346.58 (up)
- 4{-1} Minor, 1/4/2022 4818.62 (down)
- 1{-2} Minute, 1/4/2022 4818.62 (down)
- S&P 500 Futures and index:
- 1{-3} Minuette, 1/4/2022, 4808.25 (down) (futures), 4818.62 (down) (index)
- S&P 500 Futures:
- 1{-4} Subminuette, 1/4/2022, 4808.25 (down)
- 1{-5} Micro, 1/4/2022, 4808.25 (down)
- 3{-6} Submicro, 8/16/2022, 4327.50 (down)
- 2{-7} Minuscule, 10/13/2022, 3502 (up)
- A{-8} Subminuscule, 10/13/2022, 3502 (up)
Learning and other resources. Elliott wave analysis provides context, not prophecy. As the 20th century semanticist Alfred Korzybski put it in his book Science and Sanity (1933), “The map is not the territory … The only usefulness of a map depends on similarity of structure between the empirical world and the map.” And I would add, in the ever-changing markets, we can judge that similarity of structure only after the fact.
See the menu page Analytical Methods for a rundown on where to go for information on Elliott wave analysis.
By Tim Bovee, Portland, Oregon, October 26, 2022
Disclaimer
Tim Bovee, Private Trader tracks the analysis and trades of a private trader for his own accounts. Nothing in this blog constitutes a recommendation to buy or sell stocks, options or any other financial instrument. The only purpose of this blog is to provide education and entertainment.
No trader is ever 100 percent successful in his or her trades. Trading in the stock and option markets is risky and uncertain. Each trader must make trading decisions for his or her own account, and take responsibility for the consequences.
License
All content on Tim Bovee, Private Trader by Timothy K. Bovee is licensed under a Creative Commons Attribution-ShareAlike 4.0 International License.
Based on a work at www.timbovee.com.

You must be logged in to post a comment.