3:57 p.m. New York time
IBM earnings play exit. I’ve exited my short bear call options spread on IBM, two days before expiry. The earnings came in better than expected, and I spent two weeks of waiting for the price to come down to my expected maximum loss. It never did, and to avoid extra work and fees, I bought back the contracts, closing the position for a 50%+ loss. I’ve updated the trade analysis with full results.
3:30 p.m. New York time
Half an hour before the closing bell. The S&P 500 made like a yo-yo after the Federal Open Market Committee announced another 75-basis-point increase in the Federal Funds Rate, falling 26 points and the rising by 46.5 points, to 3899.25, within three minutes before settling down slightly below that high. It eventually worked its way a bit higher, to 3907, and then, six minutes into Fed Chair Jerome Powell’s news conference, it rapidly fell back, to 3841.
As Macbeth, Thane of Glamis, mused in Shakespeare’s play, the market’s response to the Fed was “full of sound and fury, signifying nothing”.

[S&P 500 E-mini futures at 2:41 p.m., 1-minute bars]
The movement was consistent with all three scenarios discussed this morning. Notably, the price remained below the 50% Fibonacci retracement level and also below the upward correction high so far of 3828, attained today before the opening bell. In Elliott wave terminology, the key outcome is that rising wave 2{-7}, the upward correction, is still underway, but whether that wave internally is in rising wave A{-8} or falling wave B{-8} remains an open question. I’ve updated the chart below.
9:35 a.m. New York time
What’s happening now? The S&P 500 E-mini futures fell in overnight trading, reaching the 3740s, more than 70 points below the high of the rise that began on October 13.
What does it mean? That rise, an upward correction is nearing the end of its first internal wave…
What are the alternatives? … and indeed, that initial wave of the correction may well have ended at yesterday’s peak.
If that sounds familiar, that’s because it is the same analysis as yesterday: Three possible scenarios with no way to choose from among them.
In addition to the principal analysis — first internal wave still rising — and the first alternative — first internal wave ended yesterday — there is a second alternative — the first leg of the correction is in its middle internal wave rather than the first. Details in the Elliott wave theory section below.
Chart note. I’ve placed the Fibonacci retracement ladder, in red, on the decline that began on August 16, which the rise from October 13 is correcting. So far the correction has taken back half of the preceding decline at yesterday’s peak, 3928.
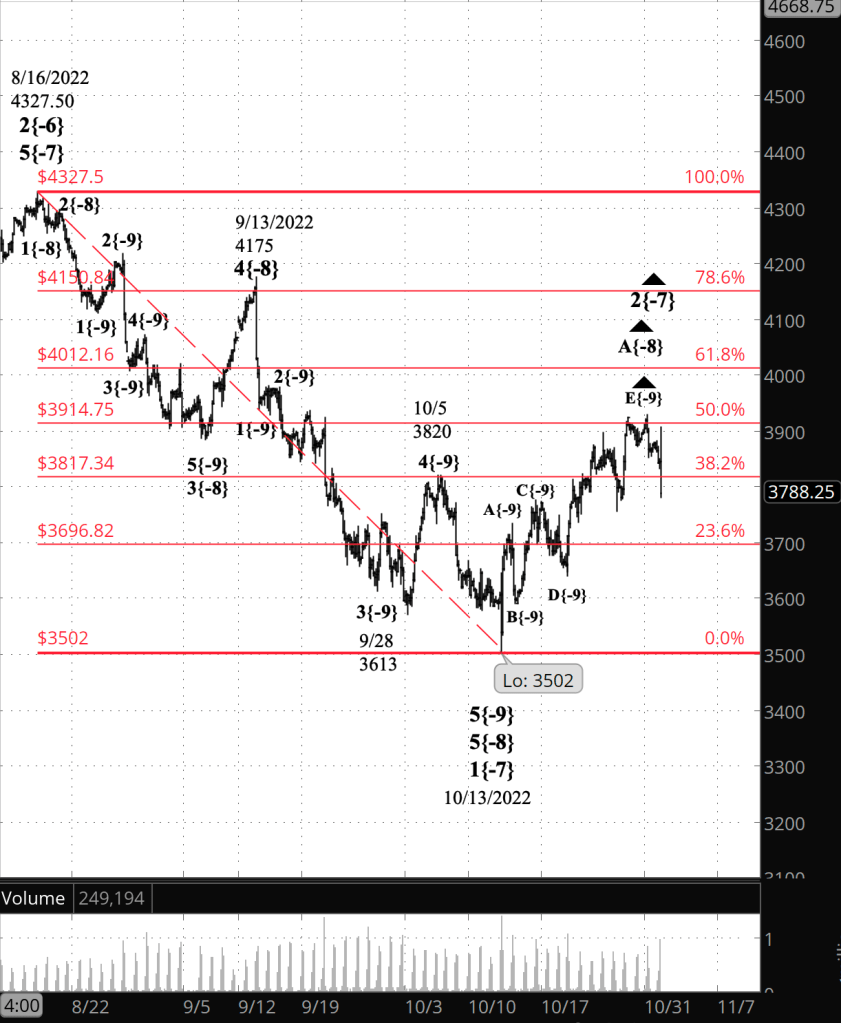
[S&P 500 E-mini futures at 3:30 p.m., 3-hour bars, with volume]
What does Elliott wave theory say? All three scenarios are occurring within wave 2{-7}, an upward correction that began on October 13, which is part of an energetic downtrend, wave 3{-6}, that began on August 16.
The principal analysis sees wave A{-8} — the first subwave within wave 2{-7} — as being in its 5th and final internal wave, E{-9}.
The first alternative analysis sees wave A{-8} as having ended at yesterday’s high. Wave B{-8} under this scenario is now underway.
The second alternative sees wave A{-8} as being in its middle subwave, which is wave C{-9}.
See yesterday’s “Trader’s Notebook” for a more detailed explanation of the three scenarios.
We Are Here.
These are the waves currently in progress under my principal analysis. Each line on the list shows the wave number, with the subscript in curly brackets, the traditional degree name, the starting date, the starting price of the S&P 500 E-mini futures, and the direction of the wave.
- S&P 500 Index:
- 5{+3} Supercycle, 7/8/1932, 4.40 (up)
- 5{+2} Cycle, 12/9/1974, 60.96 (up)
- 5{+1} Primary, 3/6/2009, 666.79 (up)
- 5{0} Intermediate, 12/26/2018, 2346.58 (up)
- 4{-1} Minor, 1/4/2022 4818.62 (down)
- 1{-2} Minute, 1/4/2022 4818.62 (down)
- S&P 500 Futures and index:
- 1{-3} Minuette, 1/4/2022, 4808.25 (down) (futures), 4818.62 (down) (index)
- S&P 500 Futures:
- 1{-4} Subminuette, 1/4/2022, 4808.25 (down)
- 1{-5} Micro, 1/4/2022, 4808.25 (down)
- 3{-6} Submicro, 8/16/2022, 4327.50 (down)
- 2{-7} Minuscule, 10/13/2022, 3502 (up)
- B{-8} Subminuscule, 10/16/2022, 3897.50 (down)
Learning and other resources. Elliott wave analysis provides context, not prophecy. As the 20th century semanticist Alfred Korzybski put it in his book Science and Sanity (1933), “The map is not the territory … The only usefulness of a map depends on similarity of structure between the empirical world and the map.” And I would add, in the ever-changing markets, we can judge that similarity of structure only after the fact.
See the menu page Analytical Methods for a rundown on where to go for information on Elliott wave analysis.
By Tim Bovee, Portland, Oregon, November 2, 2022
Disclaimer
Tim Bovee, Private Trader tracks the analysis and trades of a private trader for his own accounts. Nothing in this blog constitutes a recommendation to buy or sell stocks, options or any other financial instrument. The only purpose of this blog is to provide education and entertainment.
No trader is ever 100 percent successful in his or her trades. Trading in the stock and option markets is risky and uncertain. Each trader must make trading decisions for his or her own account, and take responsibility for the consequences.
License
All content on Tim Bovee, Private Trader by Timothy K. Bovee is licensed under a Creative Commons Attribution-ShareAlike 4.0 International License.
Based on a work at www.timbovee.com.

You must be logged in to post a comment.