3:30 p.m. New York time
Half an hour before the closing bell. The S&P 500 set a session high, 3805.50 on the futures, reached in the second hour of trading. The price then declined, trading narrowly between the 3710s and the 3750s. In Elliott wave terminology, wave B{-8}, the downward second wave within an upward correction, wave 2{-7}, is still underway. The price target range for the B wave endpoint is 3591 to 3764. The morning high was above the upper boundary and the price immediately withdrew into the target range, trading just below that upper boundary. I’ve updated the upper (near-term) chart.
9:35 a.m. New York time
What’s happening now? The S&P 500 E-mini futures fluctuated sideways in the mid-3700s overnight, breaking that pattern only once, with a dramatic 58-point swing lasting 5 minutes after the U.S. employment numbers were released. The price then settled back in the mid-3700s;
What does it mean? The fluctuation means little, just small bump in a larger decline that began on October 28 from 4924.25. The decline is the middle wave within an upward correction that began on October 13. That middle wave has carried the price from a 50% Fibonacci retracement (3915) of the downtrend that lasted from August 16 to October 13 down to a 23.6% retracement (3697).
The middle wave of the correction will be followed by a third and possibly final wave that is almost certain to carry the price above the 50% retracement level, and perhaps significantly so, up to the 61.8% (4012) Fibonacci retracement or the 78.6% retracement (4151).
This upward correction cannot exceed the starting point of the preceding downtrend, 4327.50. That’s the upper limit of its rise.
What are the alternatives? The middle leg of the upward correction has three waves internally and is in its third wave. It may have ended at Thursday’s low, 3704.25.
The upward correction will end with its third internal wave unless it forms a compound structure, linking two or three corrective patterns together.
Chart note. The Fibonacci ladder, an aid to tracking retracements, is shown on the chart in red. The likely price target range of the second wave of the corrective pattern is shown in with dashed lines.
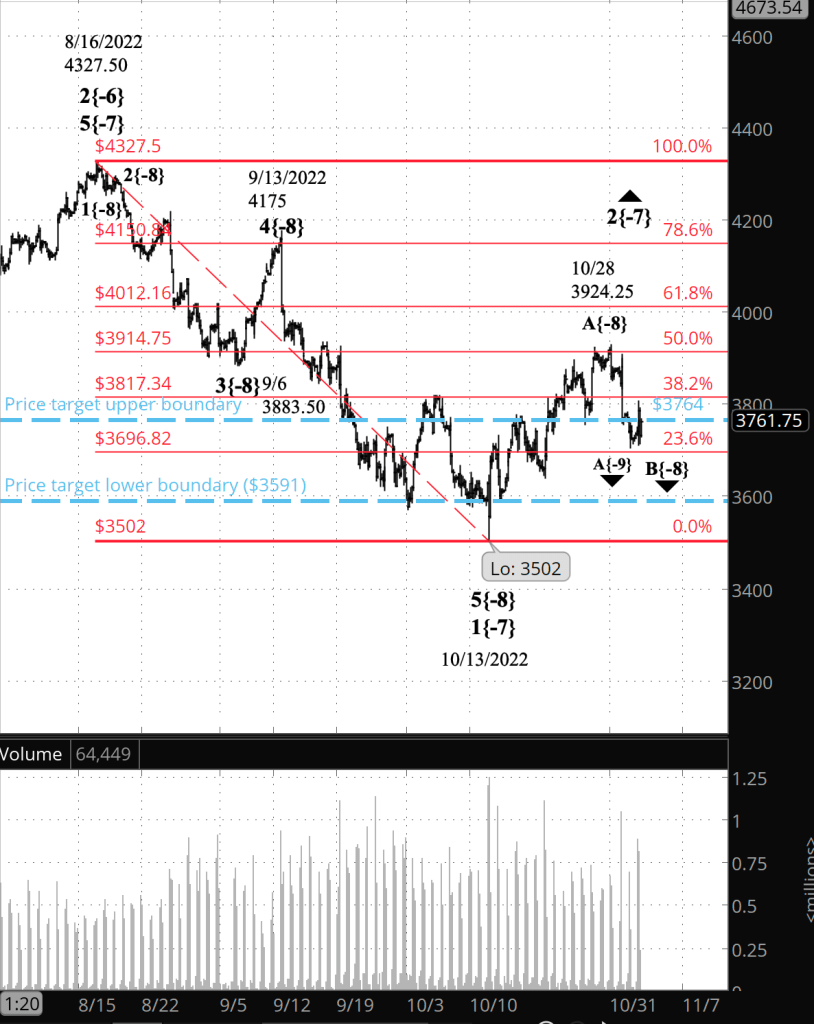
[S&P 500 E-mini futures at 3:30 p.m., 200-minute bars, with volume]
What does Elliott wave theory say? An upward correction, wave 2{-7}, that began on October 13 from 3502 is underway, and the middle wave of the corrective pattern, wave B{-8}, is nearing its end. Wave B{-8} has remained within the likely range of its terminus, 3591 to 3764, since October 3. The B wave will be followed by rising wave C{-8}, the final wave of the corrective pattern, which will likely rise into the 4000s.
The end of wave B{-8} will be signaled by a dramatic move to the upside. That hasn’t happened yet, but it’s not unusual for an end point to be followed by some hesitation before the reversal kicks off.
Wave C{-8}, which will follow wave B{-8}, will rise beyond B{-8}’s starting point, perhaps significantly so.
The upward correction, wave 2{-7}, will end with wave C{-8}, unless it forms a compound corrective pattern. If that’s the case, then wave C{-8} will be followed by a declining connective wave, X{-8}, and then by a second corrective patterns.
Second waves, such as the present wave 2{-7}, are less likely to go compound than are the other corrective waves in a trend, the 4th waves.
Wave 3{-7}, a powerful downtrend, will follow wave 2{-7}, carrying the price significantly lower.
Encompassing all of this is wave 3{-6}, a downtrend that began on August 16 from 4327.50. It, in turn, is encompassed by a series of downtrending 1st waves that began on January 4 from 4818.62 on the index. In degree the nested series of 1st waves ranges from wave 1{-5}, the smallest, to wave 1{-2}, the largest, which in turn in encompassed by declining wave 4{-1}, the next-to-the-last wave within wave 5{0}, the final wave within an expanding Diagonal Triangle that began on December 26, 2018.
Those 1st waves are important to traders, because they show no matter how much optimism is generated by the upward corrections along the way, the direction of the S&P 500 is down, down, down. The upward corrections can be played by traders — I’ve bought and sold stocks all week that benefit from the wave 2{-7} rise of the S&P 500 — but I’ll be cautious and suspicious of upward moves until wave 5{-1} begins, the final wave of the expanding Diagonal Triangle that will carry the price back up 4818, most likely significantly above that level.
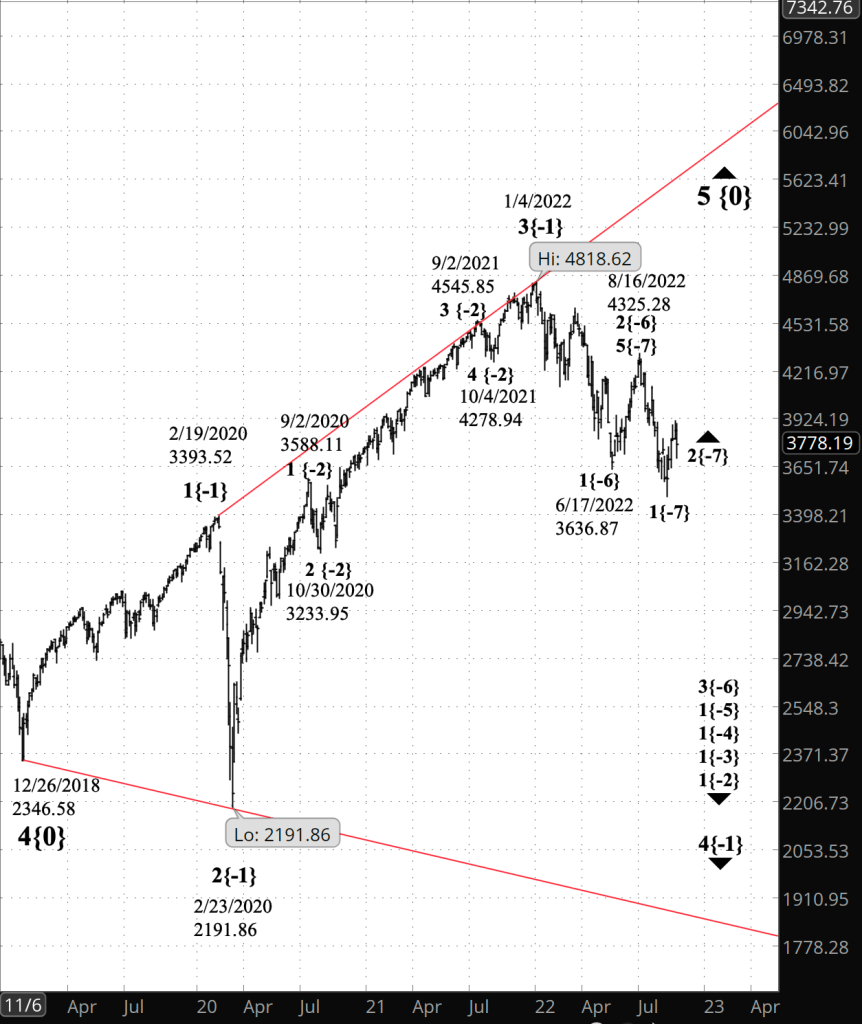
S&P 500 index at 9:30 a.m., 3-day bars]
We Are Here.
These are the waves currently in progress under my principal analysis. Each line on the list shows the wave number, with the subscript in curly brackets, the traditional degree name, the starting date, the starting price of the S&P 500 E-mini futures, and the direction of the wave.
- S&P 500 Index:
- 5{+3} Supercycle, 7/8/1932, 4.40 (up)
- 5{+2} Cycle, 12/9/1974, 60.96 (up)
- 5{+1} Primary, 3/6/2009, 666.79 (up)
- 5{0} Intermediate, 12/26/2018, 2346.58 (up)
- 4{-1} Minor, 1/4/2022 4818.62 (down)
- 1{-2} Minute, 1/4/2022 4818.62 (down)
- S&P 500 Futures and index:
- 1{-3} Minuette, 1/4/2022, 4808.25 (down) (futures), 4818.62 (down) (index)
- S&P 500 Futures:
- 1{-4} Subminuette, 1/4/2022, 4808.25 (down)
- 1{-5} Micro, 1/4/2022, 4808.25 (down)
- 3{-6} Submicro, 8/16/2022, 4327.50 (down)
- 2{-7} Minuscule, 10/13/2022, 3502 (up)
- B{-8} Subminuscule, 10/28/2022, 3924.25 (down)
Learning and other resources. Elliott wave analysis provides context, not prophecy. As the 20th century semanticist Alfred Korzybski put it in his book Science and Sanity (1933), “The map is not the territory … The only usefulness of a map depends on similarity of structure between the empirical world and the map.” And I would add, in the ever-changing markets, we can judge that similarity of structure only after the fact.
See the menu page Analytical Methods for a rundown on where to go for information on Elliott wave analysis.
By Tim Bovee, Portland, Oregon, November 4, 2022
Disclaimer
Tim Bovee, Private Trader tracks the analysis and trades of a private trader for his own accounts. Nothing in this blog constitutes a recommendation to buy or sell stocks, options or any other financial instrument. The only purpose of this blog is to provide education and entertainment.
No trader is ever 100 percent successful in his or her trades. Trading in the stock and option markets is risky and uncertain. Each trader must make trading decisions for his or her own account, and take responsibility for the consequences.
License
All content on Tim Bovee, Private Trader by Timothy K. Bovee is licensed under a Creative Commons Attribution-ShareAlike 4.0 International License.
Based on a work at www.timbovee.com.

You must be logged in to post a comment.