3:30 p.m. New York time
Half an hour before the closing bell. The S&P 500 rose early in the session, to 3867 on the futures, and then dropped back to the 38.2% Fibonacci retracement level, at 3817. Upward wave B{-9} within downward wave B{-8} within an upward correction, wave 2{-7} are all underway. No change in the analysis. I’ve updated the chart.
9:35 a.m. New York time
What’s happening now? The S&P 500 E-mini futures traded narrowly overnight, staying within the 3800s close to the 38.2% Fibonacci retracement level.
What does it mean? An upward correction that began on October 13 is in its second wave, which is a downward movement. A third internal wave will rise above the end of the first wave reached on October 28 at 3924, completing the corrective pattern.
What are the alternatives? The October 28 high could have been the end of the upward correction. I don’t take this alternative seriously because the subwaves seem disproportionately small. Nonetheless, it’s possible.
Why is the market stalling? My best guess: The Bureau of Labor Statistics releases new inflation data on Thursday, an hour before the opening bell, and I think a lot of trade decisions are showing caution as that new information release approaches.
Chart note. The chart is a bit complicated by overlays at this point. The Fibonacci ladder, showing the retracement of the decline that began on August 16, is in red. The two blue horizontal lines are the upper and lower boundaries of the price target range of the second wave of the upward correction.
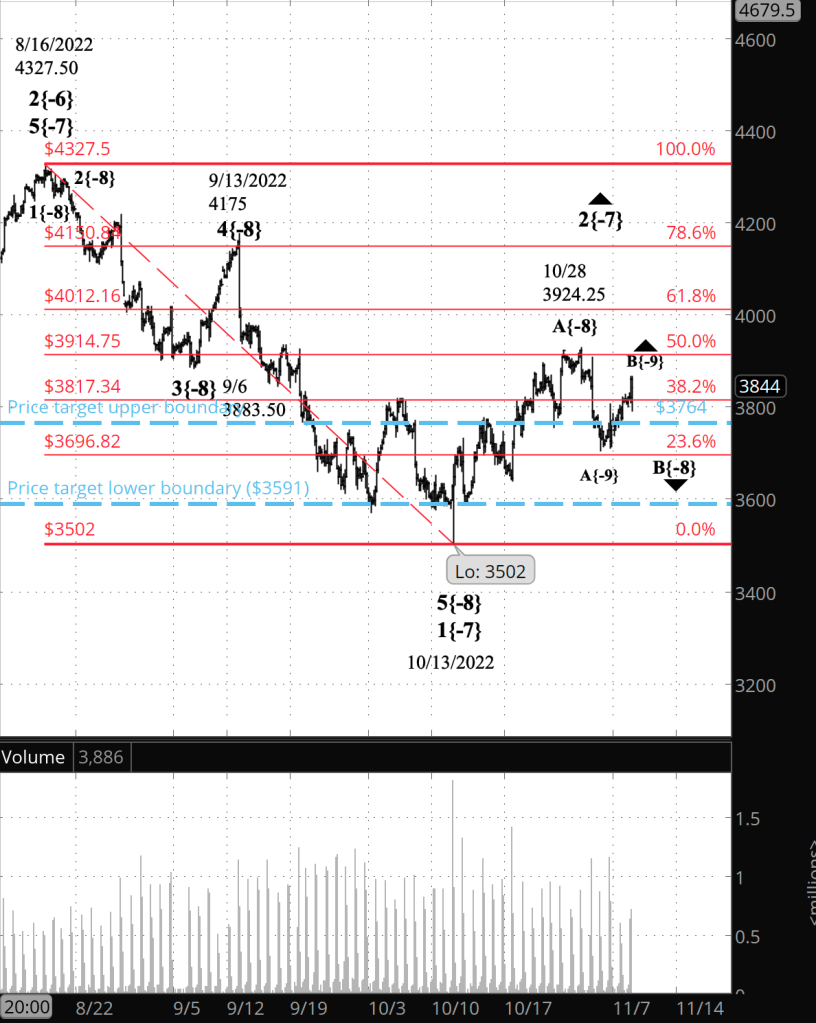
[S&P 500 E-mini futures at 3:30 p.m., 220-minute bars, with volume]
What does Elliott wave theory say? The upward correction is wave 2{-7}, the second wave within downtrending wave 3{-6}, which began on August 16.
Internally, according to the principal analysis, wave B{-8}, the middle wave of a Zigzag pattern, is underway. Wave B{-8} is in its middle subwave, B{-9}, which is rising. It will be followed by wave C{-8}, the final wave in the Zigzag, which will rise above 3924, the endpoint of wave A{-8}.
Most likely wave C{-8} will be the end of the correction. However, sometimes corrections take a compound structure, linking two or three corrective patterns together.
Downtrending wave 3{-6}, the parent wave of the correction, is in turn enclosed by a series increasingly larger downtrending 1st waves, up to wave 1{-2}, four degrees larger. Above the entire structure of nested waves is wave 4{-1}, a downtrending wave that is the next-to-the-last wave within an expanding Diagonal Triangle that began on December 26, 2018.
Wave 4{-1} will be followed by the triangle’s final segment, wave 5{-1}, which probably will rise above 4818.62 on the index, the beginning of wave 4{-1} on January 4. Fifth waves are like donkeys,.We know what they’re supposed to do — move above the prior high — but sometimes they get stubborn and come up short.
In any case, the end of the triangle will be the start of a downtrend of massive proportion that will take decades to complete, although there will be many chances to profit from very large upward corrections within the downtrend.
We Are Here.
These are the waves currently in progress under my principal analysis. Each line on the list shows the wave number, with the subscript in curly brackets, the traditional degree name, the starting date, the starting price of the S&P 500 E-mini futures, and the direction of the wave.
- S&P 500 Index:
- 5{+3} Supercycle, 7/8/1932, 4.40 (up)
- 5{+2} Cycle, 12/9/1974, 60.96 (up)
- 5{+1} Primary, 3/6/2009, 666.79 (up)
- 5{0} Intermediate, 12/26/2018, 2346.58 (up)
- 4{-1} Minor, 1/4/2022 4818.62 (down)
- 1{-2} Minute, 1/4/2022 4818.62 (down)
- S&P 500 Futures and index:
- 1{-3} Minuette, 1/4/2022, 4808.25 (down) (futures), 4818.62 (down) (index)
- S&P 500 Futures:
- 1{-4} Subminuette, 1/4/2022, 4808.25 (down)
- 1{-5} Micro, 1/4/2022, 4808.25 (down)
- 3{-6} Submicro, 8/16/2022, 4327.50 (down)
- 2{-7} Minuscule, 10/13/2022, 3502 (up)
- B{-8} Subminuscule, 10/28/2022, 3924.25 (down)
Learning and other resources. Elliott wave analysis provides context, not prophecy. As the 20th century semanticist Alfred Korzybski put it in his book Science and Sanity (1933), “The map is not the territory … The only usefulness of a map depends on similarity of structure between the empirical world and the map.” And I would add, in the ever-changing markets, we can judge that similarity of structure only after the fact.
See the menu page Analytical Methods for a rundown on where to go for information on Elliott wave analysis.
By Tim Bovee, Portland, Oregon, November 8, 2022
Disclaimer
Tim Bovee, Private Trader tracks the analysis and trades of a private trader for his own accounts. Nothing in this blog constitutes a recommendation to buy or sell stocks, options or any other financial instrument. The only purpose of this blog is to provide education and entertainment.
No trader is ever 100 percent successful in his or her trades. Trading in the stock and option markets is risky and uncertain. Each trader must make trading decisions for his or her own account, and take responsibility for the consequences.
License
All content on Tim Bovee, Private Trader by Timothy K. Bovee is licensed under a Creative Commons Attribution-ShareAlike 4.0 International License.
Based on a work at www.timbovee.com.

You must be logged in to post a comment.