3:30 p,m, New York time
Half an hour before the closing bell. The S&P 500 futures fell sharply after the Federal Open Market Committee announced it was doing what everyone has expected for weeks: Lowered the Federal Funds Rate by 50 basis points instead of by 75 bps. It then fell further early in Fed Chairman Jerome Powell’s news conference.
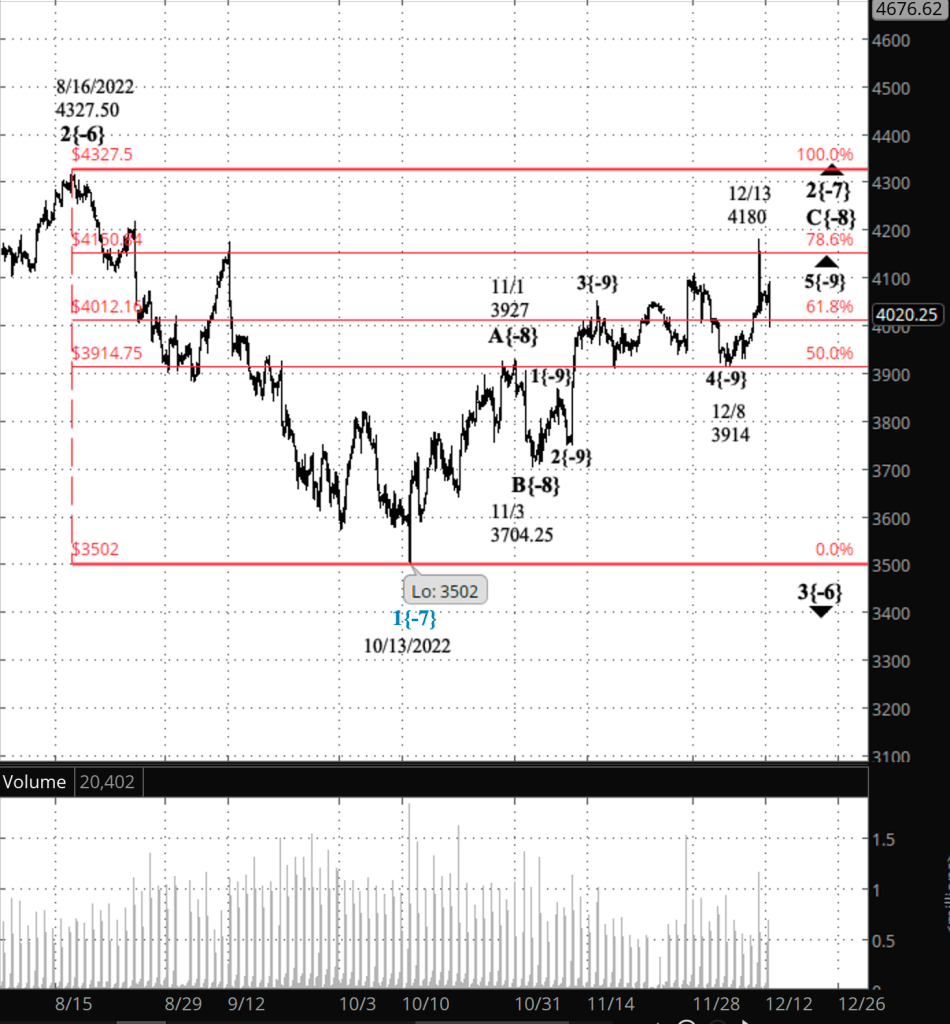
The price has declined in a day from 4180 to 3997.
No change in this morning’s analysis. An upward correction, wave 2{-7}, continues and is in its final leg, wave C{-8}. However, the lower the price declines, the more likely it is that the upward correction ended yesterday, December 13, and that a downtrend, wave 3{-7}, has begun.
I’ve updated the chart.
9:35 a.m. New York time
What’s happening now? The S&P 500 E-mini futures traded in a narrow range overnight, remaining between the 4040s and the 4070s.
What does it mean? An upward correction that began on October 13 is underway and is in its final leg. So far it has has retraced a bit more than 79% of the downtrending wave that preceded it.
What are the alternatives? There are two.
- Alternative #1: The December 13 peak, 4180, was the end of the upward correction and a significant downtrend has begun.
- Alternative #2: The December 13 peak ended the first corrective pattern within a compound correction. The subsequent decline will connect the first corrective pattern with a second one, and a third correct pattern might follow.
Chart note. With the upward correction still underway, I have again placed retracement levels on the chart, in red. The lines show levels where prices often will pause or reverse. They are called Fibonacci levels, and the developer of Elliott wave analysis in the 1930s, R.N. Elliott, an accountant, considered them to be important in understanding the chart.
A core concept in Elliott’s analysis is that directional movements — “waves”, as he called them — all follow the same pattern, whether they be large or small. A stock chart is built by waves, with larger waves containing building blocks of smaller waves, and the larger waves being building blocks of still larger waves. The technical term for such a structure is a “fractal” structure.
On the chart, trending waves are numbered, and corrective waves are labeled with letters. In order to show where each wave stands relative to others within the fractal structure, I use subscripts showing each wave’s degree — its relative size.
[S&P 500 E-mini futures at 3:30 p.m., 4-hour bars, with volume]
What does Elliott wave theory say? At this point our analytical task is to figure out where and when the upward correction ends. This is almost always a thankless task that results in several false calls before there’s a success. Unlike a film, the chart has no sign that says “The End”.
There are, however, indicators that give a hint. Those indicators are waves and their internal structures. Here are the one’s I’m relying on.
- The upward correction that began on October 13 is wave 2{-7}. Most often, a 2nd wave has three subwaves, forming a corrective pattern.
- Wave 2{-7} is in its third subwave, C{-8}. The C wave has five waves within it and is in its final subwave.
- The final subwave is wave 5{-9}.
A final subwave within a final subwave — it’s clear that wave 2{-7} is reaching an end.
And then there are the alternative analyses.
- Alternative #1: Wave 2{-7} and its subwaves ended on December 13 at 4180, and a downtrend, wave 3{-7} has begun.
- Alternative #2: Wave 2{-7} is forming a compound structure and is presently in wave X{-8}, connecting the now complete first corrective pattern with a future second pattern.
What lies ahead? Whenever wave 2{-7} ends, it will be followed by a significant downtrend, wave 3{-7}. Third waves are almost always the longest and most powerful subwaves within a five-wave trending wave. At a minimum, I expect wave 3{-7} to fall to the 3350s, a level last seen in October 2020. And it will almost certainly fall much farther.
Everything I’ve discussed so far is happening within a still larger wave, 3{-6}, which began on August 16, within an even larger wave, 1{-5}, which began on January 4. They are downtrending waves that are contained within still larger downtrending waves, all the way up to wave 4{-1}, which also began on January 4. Wave 4{-1} is a subwave of wave 5{0} — one degree higher — which began on December 26, 2018.
So yes, the market, as always, will have its ups and downs, and there will be profits to be made trading those fluctuations, but the larger trends for the next years or two and even longer will be down.
We Are Here.
These are the waves currently in progress under my principal analysis. Each line on the list shows the wave number, with the subscript in curly brackets, the traditional degree name, the starting date, the starting price of the S&P 500 E-mini futures, and the direction of the wave.
- S&P 500 Index:
- 5{+3} Supercycle, 7/8/1932, 4.40 (up)
- 5{+2} Cycle, 12/9/1974, 60.96 (up)
- 5{+1} Primary, 3/6/2009, 666.79 (up)
- 5{0} Intermediate, 12/26/2018, 2346.58 (up)
- 4{-1} Minor, 1/4/2022 4818.62 (down)
- 1{-2} Minute, 1/4/2022 4818.62 (down)
- S&P 500 Futures and index:
- 1{-3} Minuette, 1/4/2022, 4808.25 (down) (futures), 4818.62 (down) (index)
- S&P 500 Futures:
- 1{-4} Subminuette, 1/4/2022, 4808.25 (down)
- 1{-5} Micro, 1/4/2022, 4808.25 (down)
- 3{-6} Submicro, 8/16/2022, 4327.50 (down)
- 3{-7} Minuscule, 12/1/2022, 4110 (down)
- 1{-8} Subminuscule, 12/1/2022, 4110 (down)
Learning and other resources. Elliott wave analysis provides context, not prophecy. As the 20th century semanticist Alfred Korzybski put it in his book Science and Sanity (1933), “The map is not the territory … The only usefulness of a map depends on similarity of structure between the empirical world and the map.” And I would add, in the ever-changing markets, we can judge that similarity of structure only after the fact.
See the menu page Analytical Methods for a rundown on where to go for information on Elliott wave analysis.
By Tim Bovee, Portland, Oregon, December 14, 2022
Disclaimer
Tim Bovee, Private Trader tracks the analysis and trades of a private trader for his own accounts. Nothing in this blog constitutes a recommendation to buy or sell stocks, options or any other financial instrument. The only purpose of this blog is to provide education and entertainment.
No trader is ever 100 percent successful in his or her trades. Trading in the stock and option markets is risky and uncertain. Each trader must make trading decisions for his or her own account, and take responsibility for the consequences.
License
All content on Tim Bovee, Private Trader by Timothy K. Bovee is licensed under a Creative Commons Attribution-ShareAlike 4.0 International License.
Based on a work at www.timbovee.com.

You must be logged in to post a comment.