3:30 p.m. New York time
Half an hour before the closing bill. The S&P 500 fell during the session, reaching into the 3780s on the futures. The low for the session was below the starting point of a small upward correction that began December 19 from 3803.50 and ended December 21 at 3919.75.
The upward correction was wave 2{-9}, within the first wave, 1{-8}, of a larger downtrend, wave 3{-7}.
Under the rules of Elliott wave analysis, a 2nd wave never moves below its own starting point, as the price did during the session. Therefore, the most likely analysis is that wave 2{-9} ended at the peak from which the present decline began.
Wave 3{-9}, like all 3rd waves, can be expected to show exceptional energy appropriate for its size. The preceding 1st wave, waver 1{-9}, covered 376.5 points on the futures chart. The 3rd wave is almost always longer than the preceding 1st wave. So at a minimum, I expect wave 3{-9} to fall to the 3540s, and probably far lower.
Second waves usually take the form of a Zigzag, with five subwaves within the first segment of the three wave correction. Those five subwaves aren’t clearly visible, leaving room for an alternative analysis: Wave 2{-9} is still underway and is taking the form of a Triangle, with the present decline being the second subwave of the pattern. Triangles have five subwaves.
I’ve updated the chart.
9:35 a.m. New York time
What’s happening now? The S&P 500 E-mini futures rose overnight, carrying the price to 3919.75 in a rise that began on December 19 from 3803.50.
What does it mean? The rise is the first leg of a low-level upward correction within a downtrend that began on December 13. When the correction complete, it will be followed by a resumption of the downtrend.
What are the alternatives? The two that have been with us since the December 13 start of the downtrend:
Alternative #1: The final leg of the upward correction that began on October 13 is still underway. A decline below 3704.25, the beginning of that final leg, would invalidate this alternative.
Alternative #2: The upward correction is taking a compound form, with two or three corrective patterns within it. The December 13 high ended the first corrective pattern, and the decline that followed is a segment connecting the first, completed, corrective pattern with the future second corrective pattern.
A rise above 4180, the December 13 starting point of the downtrend, would validate either of the alternatives.
Chart notes. The chart shows the upward correction that began on October 13, which is complete, and the downtrend that followed, beginning on December, 13, which is still in its early stage.
The downtrend is what the developer of Elliott wave analysis in the 1930s, R.N. Elliott, called an “impulse wave”. Such waves contain five subwaves — three in the direction of the trend and two counter-trend corrections.
Elliott found that the directional movements of equity prices, which he called “waves”, all take the same forms and follow the same rules, be the waves big or small. And the wave structures are nested — waves within waves. So a larger downtrend can contain a complete smaller downtrend and can itself be a subwave of a still larger downtrend.
That nesting is clearly visible on the chart today.
The waves within a trend are numbered (within a correction, they’re lettered). And I use subscripts in curly brackets to label where in the complex nested structure a wave stands, which Elliott called a wave’s “degree”.. The smaller the subscript, the lower the degree.
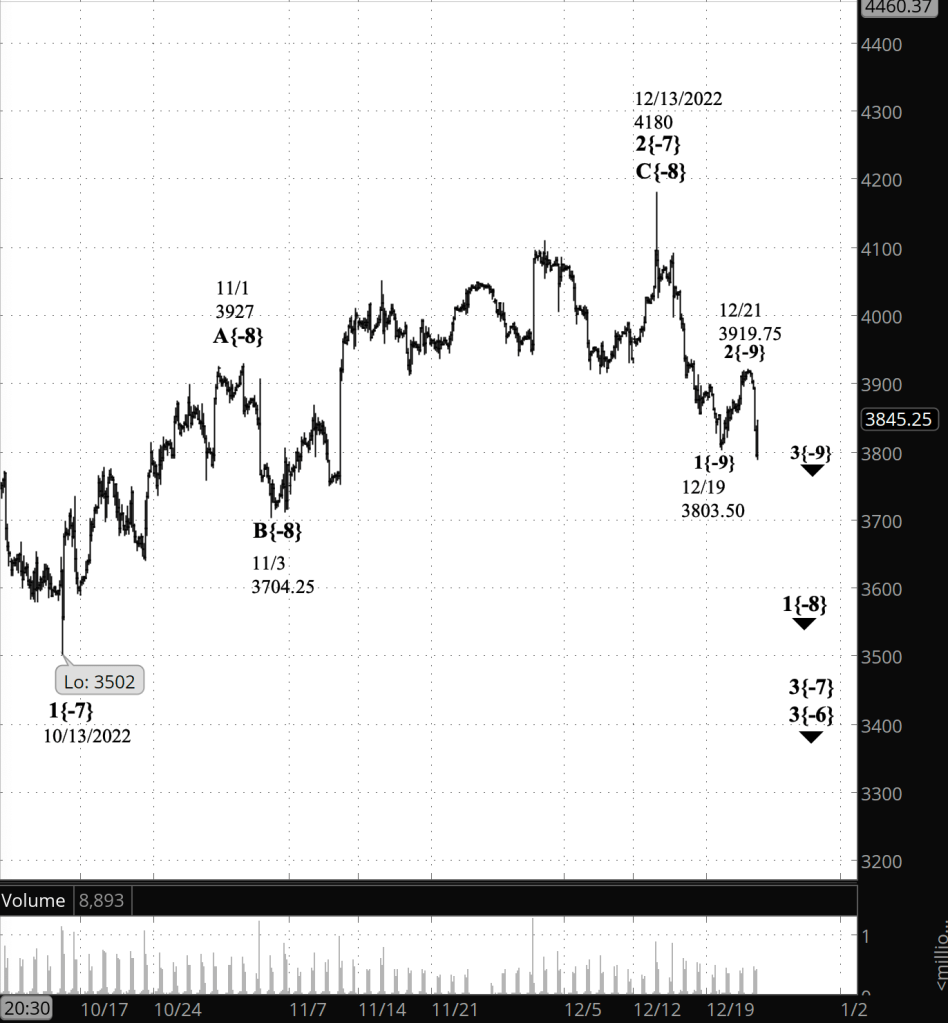
[S&P 500 E-mini futures at 3:30 p.m., 150-minute bars, with volume]
What does Elliott wave theory say? Waves within waves.
The wave structure of the principal analysis looks like this:
- The downtrend that began on December 13 is wave 3{-7} within a larger downtrend, wave 3{-6}, which began on August 16.
- The decline since December 13 is wave 1{-8}, the ongoing first subwave within wave 3{-7}.
- Wave 1{-8} completed its first wave internally on December 19. Wave 1{-8} contains a complete downtrend: wave 1{-9}.
- Within wave {1-8}, the second subwave, an upward correction labeled wave 2{-9}, began on December 19.
The alternatives both see wave 2{-7}, the larger upward correction that preceded the downtrend, as still being underway.
Alternative #1:
- The decline since December 13 is a wave within the wave C{-8}, the third and probably final wave of the larger upward correction, wave 2{-7}.
Alternative #2:
- The December 13 high completed the final subwave, C{-8}, of the first corrective pattern within wave 2{-7}, which is taking a compound form contain two or three corrective patterns.
- The decline since December 13 is wave X{-8}, connecting wave C{-8} within the now complete wave C{-8} within the now complete first corrective pattern with future wave A{-8}, the first wave of a second corrective pattern that has not yet begun.
We Are Here.
These are the waves currently in progress under my principal analysis. Each line on the list shows the wave number, with the subscript in curly brackets, the traditional degree name, the starting date, the starting price of the S&P 500 E-mini futures, and the direction of the wave.
- S&P 500 Index:
- 5{+3} Supercycle, 7/8/1932, 4.40 (up)
- 5{+2} Cycle, 12/9/1974, 60.96 (up)
- 5{+1} Primary, 3/6/2009, 666.79 (up)
- 5{0} Intermediate, 12/26/2018, 2346.58 (up)
- 4{-1} Minor, 1/4/2022 4818.62 (down)
- 1{-2} Minute, 1/4/2022 4818.62 (down)
- S&P 500 Futures and index:
- 1{-3} Minuette, 1/4/2022, 4808.25 (down) (futures), 4818.62 (down) (index)
- S&P 500 Futures:
- 1{-4} Subminuette, 1/4/2022, 4808.25 (down)
- 1{-5} Micro, 1/4/2022, 4808.25 (down)
- 3{-6} Submicro, 8/16/2022, 4327.50 (down)
- 3{-7} Minuscule, 12/1/2022, 4110 (down)
- 1{-8} Subminuscule, 12/1/2022, 4110 (down)
Learning and other resources. Elliott wave analysis provides context, not prophecy. As the 20th century semanticist Alfred Korzybski put it in his book Science and Sanity (1933), “The map is not the territory … The only usefulness of a map depends on similarity of structure between the empirical world and the map.” And I would add, in the ever-changing markets, we can judge that similarity of structure only after the fact.
See the menu page Analytical Methods for a rundown on where to go for information on Elliott wave analysis.
By Tim Bovee, Portland, Oregon, December 22, 2022
Disclaimer
Tim Bovee, Private Trader tracks the analysis and trades of a private trader for his own accounts. Nothing in this blog constitutes a recommendation to buy or sell stocks, options or any other financial instrument. The only purpose of this blog is to provide education and entertainment.
No trader is ever 100 percent successful in his or her trades. Trading in the stock and option markets is risky and uncertain. Each trader must make trading decisions for his or her own account, and take responsibility for the consequences.
License
All content on Tim Bovee, Private Trader by Timothy K. Bovee is licensed under a Creative Commons Attribution-ShareAlike 4.0 International License.
Based on a work at www.timbovee.com.

You must be logged in to post a comment.