3:30 p.m. New York time
Half an hour before the closing bell. The S&P 500 futures fell during the session to the lower boundary of the price channel, which defines a Horizontal Triangle that began on December 19. It then reversed to the upside. No change in the analysis. I’ve updated the chart.
9:35 a.m. New York time
What’s happening now? The S&P 500 E-mini futures rose when trading resumed after the New Year’s holiday, reaching 3906.75 as the opening bell approached, and then pulling back.
What does it mean? The downtrend that began on December 13 continues and internally is in an upward correction that is taking the form of a Horizontal Triangle. The upward correction will be followed by an energetic downtrend.
What are the alternatives? The Triangle can be viewed as Zig-zag pattern. The Triangle analysis seems to me to fit best, but there is, as always, some ambiguity.
Chart note. The price channel of the Triangle is drawn on the chart in red.
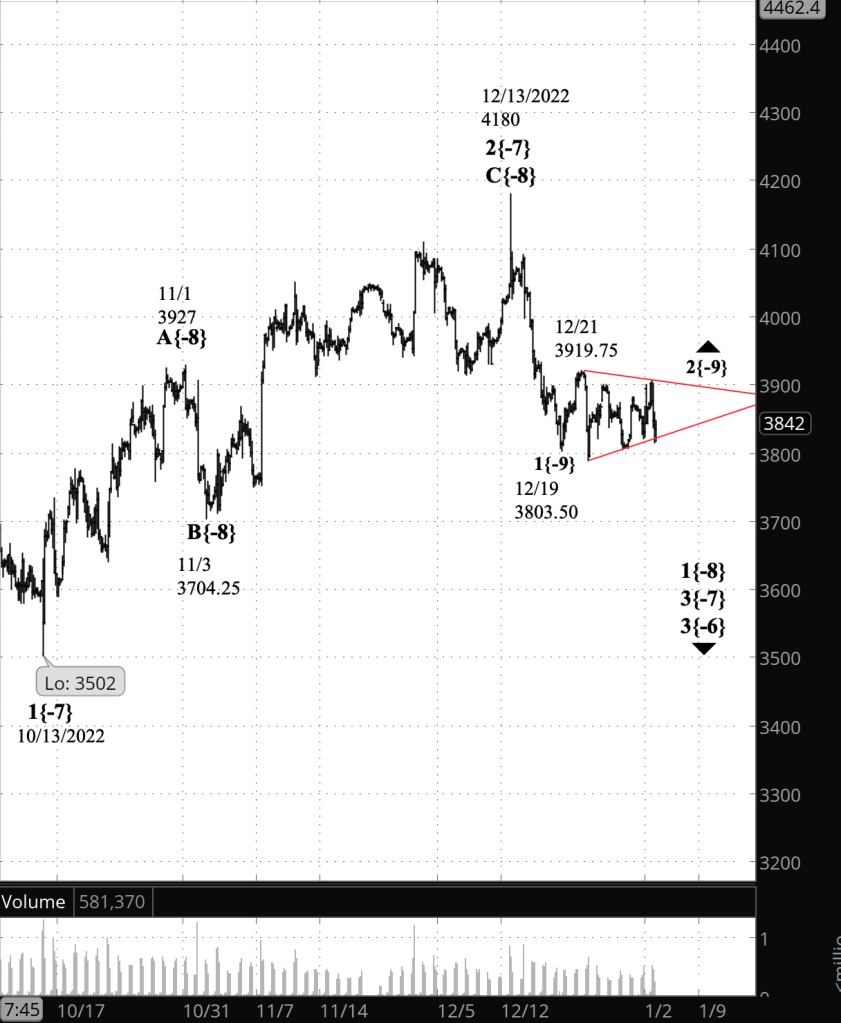
[S&P 500 E-mini futures at 3:30 p.m., 195-minute bars, with volume]
What does Elliott wave theory say? R.N. Elliott, an accountant, developed his method of analysis in the 1930s. That the market’s directional movements in price — the price waves — form repeating patterns was known Elliott’s time. His innovation lay in seeing putting those patterns as components of an elaborate structure, in which larger waves are built from smaller waves and in turn are building blocks of still larger waves.
Elliott used numbers to label the components of trending waves and letters for the components of counter-trend corrections. I follow that method on my charts and designate the relative size of each wave with a subscription in curly brackets. The subscript shows where in the complex structure each wave stands, called its “degree”. The larger the subscript number, the larger the degree.
From larger to smaller, these are the waves important to interpreting the chart.
- The downtrend that began on December 13, 2022 is wave 3{-7}.
- That wave is in its first component, downtrending wave 1{-8}.
- The component is in an upward correction, wave 2{-9}, which is taking the form of a Horizontal Triangle.
A Horizontal Triangle is constructed from five subwaves. When the Triangle is complete, it will likely be the end of wave 2{-9}.
Downtrending wave 3{-9} will follow, with the energy that is characteristic of third waves.
This is all happening within larger downtrend, wave 3{-6}, which began on August 16, 2022 and is a subwave of wave 1{-5}, which began on January 4, 2022, the starting point of a large downtrend that will characterize the markets for some time to come.
We Are Here.
These are the waves currently in progress under my principal analysis. Each line on the list shows the wave number, with the subscript in curly brackets, the traditional degree name, the starting date, the starting price of the S&P 500 E-mini futures, and the direction of the wave.
- S&P 500 Index:
- 5{+3} Supercycle, 7/8/1932, 4.40 (up)
- 5{+2} Cycle, 12/9/1974, 60.96 (up)
- 5{+1} Primary, 3/6/2009, 666.79 (up)
- 5{0} Intermediate, 12/26/2018, 2346.58 (up)
- 4{-1} Minor, 1/4/2022 4818.62 (down)
- 1{-2} Minute, 1/4/2022 4818.62 (down)
- S&P 500 Futures and index:
- 1{-3} Minuette, 1/4/2022, 4808.25 (down) (futures), 4818.62 (down) (index)
- S&P 500 Futures:
- 1{-4} Subminuette, 1/4/2022, 4808.25 (down)
- 1{-5} Micro, 1/4/2022, 4808.25 (down)
- 3{-6} Submicro, 8/16/2022, 4327.50 (down)
- 3{-7} Minuscule, 12/13/2022, 4180 (down)
- 1{-8} Subminuscule, 12/13/2022, 4180 (down)
Learning and other resources. Elliott wave analysis provides context, not prophecy. As the 20th century semanticist Alfred Korzybski put it in his book Science and Sanity (1933), “The map is not the territory … The only usefulness of a map depends on similarity of structure between the empirical world and the map.” And I would add, in the ever-changing markets, we can judge that similarity of structure only after the fact.
See the menu page Analytical Methods for a rundown on where to go for information on Elliott wave analysis.
By Tim Bovee, Portland, Oregon, January 3, 2023
Disclaimer
Tim Bovee, Private Trader tracks the analysis and trades of a private trader for his own accounts. Nothing in this blog constitutes a recommendation to buy or sell stocks, options or any other financial instrument. The only purpose of this blog is to provide education and entertainment.
No trader is ever 100 percent successful in his or her trades. Trading in the stock and option markets is risky and uncertain. Each trader must make trading decisions for his or her own account, and take responsibility for the consequences.
License
All content on Tim Bovee, Private Trader by Timothy K. Bovee is licensed under a Creative Commons Attribution-ShareAlike 4.0 International License.
Based on a work at www.timbovee.com.

You must be logged in to post a comment.