3:30 p.m. New York time
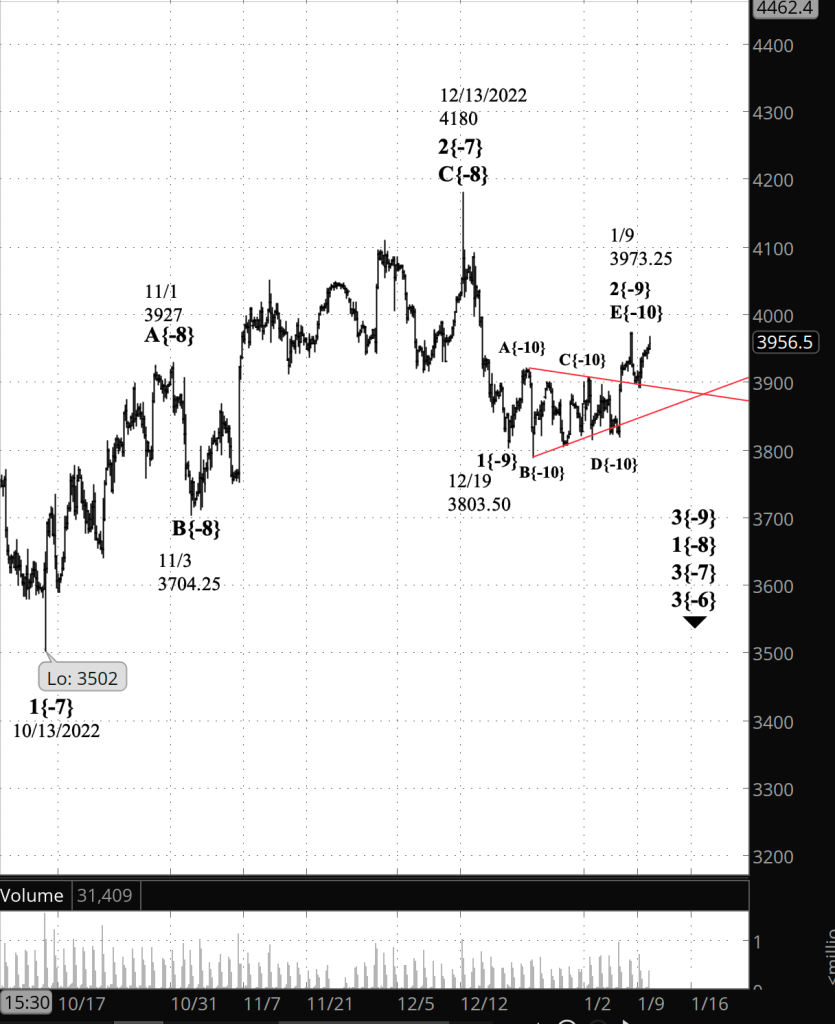
Half an hour before the closing bell. The S&P 500 futures continued to push higher during the session, reaching into the 3980s. The upward correction that began on December 19, 2022 continues. The analysis posted at 1:25 p.m. is unchanged. I’ve updated the upper chart.
1:25 p.m. New York time
Alternative analysis rules! The S&P 500 futures moved above the January 9 high, invalidating the principal analysis and replacing it with the alternative analysis that I discussed this morning.
The upward correction that began on December 19, 2022 is still underway. In Elliott wave terminology, that correction is wave 2{-9}, and internally, it is in its final segment, wave E{-10}.
When wave 2{-9} is complete, it will be followed by a downward correction, wave 3{-9}, that will carry the price significantly lower.
Chart note: The upper chart shows the revised principal analysis.

[S&P 500 E-mini futures at 3:30 p.m., 210-minute bars, with volume]
10:50 a.m. New York time
I overslept. The markets open at 6:30 a.m. my local time, and I didn’t awaken as early as usual. Like the White Rabbit in the Disney cartoon version of Lewis Carroll’s Alice in Wonderland, I’m rushing around waving a pocket watch and saying, “I’m late! I’m late! I’m very, very late!” Here’s the complete analysis.
What’s happening now? The S&P 500 E-mini futures rose slightly in overnight trading, returning to the 3960s.
What does it mean? The movement remained below the January 9 high, 3973.25, and so is consistent with the principal analysis; The downtrend that began from that high is underway, having begun from that high.
What are the alternatives? A move above that January 9 high would mean that the downtrend has not yet begun and the upward correction that began on December 19 continues.
Under the alternative, the January 9 high was the end of the first part of the final segment within the upward correction that began on December 19. A downward movement will follow, and then a rise. Only then will the downtrend begin.
Chart note: The chart below shows the analysis prior to the price moving above the January 9 high. It is outdated, but I’ve retained it for comparison with the new principal analysis, shown on the chart above.
[Outdated analysis: S&P 500 E-mini futures at 10:50 a.m., 210-minute bars, with volume]
What does Elliott wave theory say? Under the principal analysis,
- A downtrend, wave 3{-9} is underway. It began on January 9.
- It is presently in an upward correction, wave 2{-10}.
- As a 3rd wave, it will typically show a lot of energy as it reaches its middle subwave, 3{-10}, which will carry the price substantially lower.
- Wave 3{-9} is segment of wave 1{-8}, which in turn is a subwave of wave 3{-7}. Both began on December 1.
Under the alternative analysis,
- An upward correction, wave 2{-9}, is underway. It began on December 19.
- It is presently in its final segment, rising wave E{-10}.
- The end of wave E{-10} will also be the end of the upward correction, wave 2{-9}.
- It will also mark the start of a downtrend, wave 3{-9}
We Are Here.
These are the waves currently in progress under my principal analysis. Each line on the list shows the wave number, with the subscript in curly brackets, the traditional degree name, the starting date, the starting price of the S&P 500 E-mini futures, and the direction of the wave.
- S&P 500 Index:
- 5{+3} Supercycle, 7/8/1932, 4.40 (up)
- 5{+2} Cycle, 12/9/1974, 60.96 (up)
- 5{+1} Primary, 3/6/2009, 666.79 (up)
- 5{0} Intermediate, 12/26/2018, 2346.58 (up)
- 4{-1} Minor, 1/4/2022 4818.62 (down)
- 1{-2} Minute, 1/4/2022 4818.62 (down)
- S&P 500 Futures and index:
- 1{-3} Minuette, 1/4/2022, 4808.25 (down) (futures), 4818.62 (down) (index)
- S&P 500 Futures:
- 1{-4} Subminuette, 1/4/2022, 4808.25 (down)
- 1{-5} Micro, 1/4/2022, 4808.25 (down)
- 3{-6} Submicro, 8/16/2022, 4327.50 (down)
- 3{-7} Minuscule, 12/1/2022, 4110 (down)
- 1{-8} Subminuscule, 12/1/2022, 4110 (down)
Learning and other resources. Elliott wave analysis provides context, not prophecy. As the 20th century semanticist Alfred Korzybski put it in his book Science and Sanity (1933), “The map is not the territory … The only usefulness of a map depends on similarity of structure between the empirical world and the map.” And I would add, in the ever-changing markets, we can judge that similarity of structure only after the fact.
See the menu page Analytical Methods for a rundown on where to go for information on Elliott wave analysis.
By Tim Bovee, Portland, Oregon, January 11, 2023
Disclaimer
Tim Bovee, Private Trader tracks the analysis and trades of a private trader for his own accounts. Nothing in this blog constitutes a recommendation to buy or sell stocks, options or any other financial instrument. The only purpose of this blog is to provide education and entertainment.
No trader is ever 100 percent successful in his or her trades. Trading in the stock and option markets is risky and uncertain. Each trader must make trading decisions for his or her own account, and take responsibility for the consequences.
License
All content on Tim Bovee, Private Trader by Timothy K. Bovee is licensed under a Creative Commons Attribution-ShareAlike 4.0 International License.
Based on a work at www.timbovee.com.

You must be logged in to post a comment.