3:30 p.m. New York time
Half an hour before the closing bell. The S&P 500 futures reached a high during the session of 4035.25 — less than a point of the 61.8% Fibonacci retracement level — and then reversed sharply, declining to 4002.75 and then taking back some of the fall.
The pattern is consistent with a low-degree downward movement before a final push to the top, and if that’s what it turns out to be, then the upward correction, wave 2{-9}, is not yet finished but is about to reach its end. It is also consistent with the beginning of a downtrend, wave 3{-9}, after wave 2{-9} ended at 4035.25.
The chart’s wave labelings from this morning are based on the first interpretation — wave 2{-9} is underway — and I shall retain them for now until there’s greater clarity. I’ve added a short-term chart covering yesterday’s holiday trading and today’s.

[S&P 500 E-mini futures at 3:20 p.m., 5-minute bars, with volume]
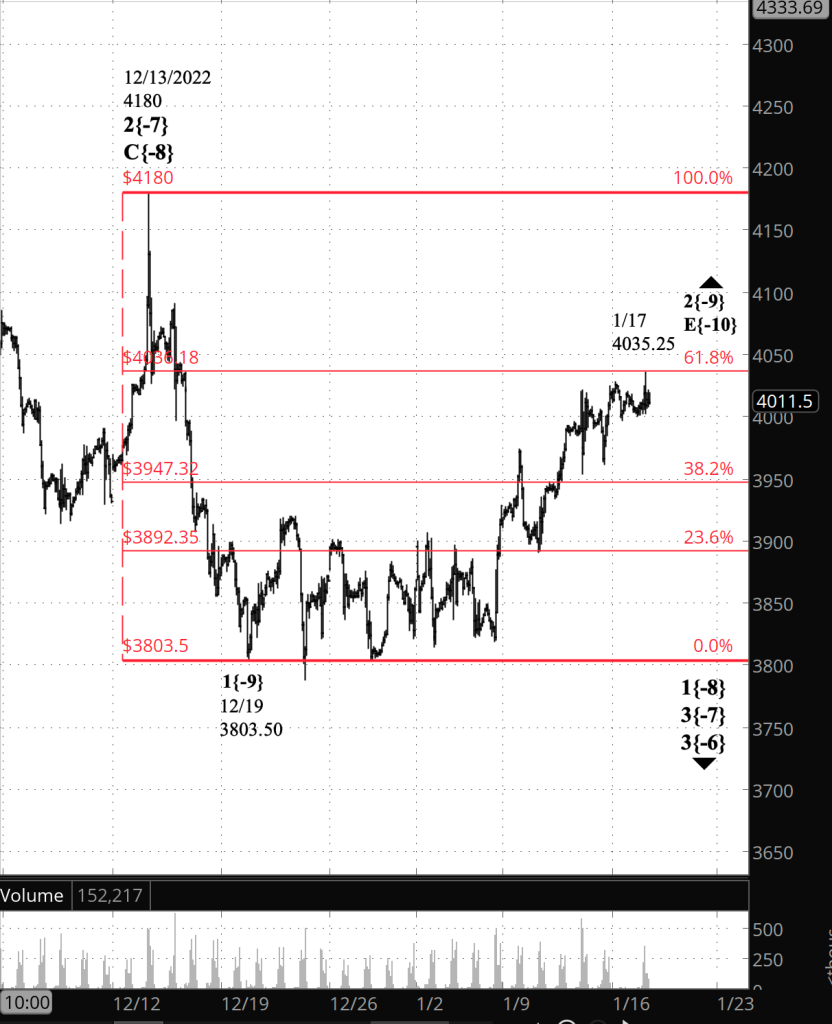
10:20 a.m. New York time
New correction high. And the price has risen to a new high within the upward correction, wave 2{-9}. The price broke above Sunday’s high about half an hour into the session, reaching 4034.25 so far and confirming the principal analysis.
9:35 a.m. New York time
What’s happening now? The S&P 500 E-mini futures continued to work their way lower, remaining below Sunday evening’s peak, 4028.25, and above Monday morning’s low of 3996.75. At the opening bell the price approached that peak, coming to within four points.
What does it mean? The further the price falls, the more likely it becomes that Sunday’s high marked the end of the upward correction that began on December 19, 2022. The correction high fell a few points short of the 61.8% Fibonacci retracement level, which is a common reversal point, and my principal analysis continues to show the correction as still underway.
What are the alternatives? At this point any peak potentially be the end of the correction and the beginning of a downtrend that will carry the price significantly lower.
Chart notes. I’ve superimposed a Fibonacci retracement ladder on the chart, in red, showing how much the correction has retraced the decline from December 13 to December 19 last year.
In Elliott wave analysis, a directional movement is called a wave, larger waves are built from smaller waves and in turn on the building blocks of still larger waves in a fractal pattern, all waves big and small exhibit the same patterns and follow the same rules. On the chart, subwaves of trending waves are numbered, and subwaves of corrective waves are labeled with letters. I show the relative place of each wave in the fractal hierarchy — its degree — with a subscript contained within curly brackets. The lower the subscript number, the smaller the degree.
[S&P 500 E-mini futures at 3:30 p.m., 90-minute bars, with volume]
What does Elliott wave theory say? Unchanged from yesterday’s post.
Under the principal analysis,
- The upward correction that began on December 19, 2022 is wave 2{-9}
- It is in its final subwave, E{-10}.
- The end of wave E{-10} will also be the end of wave 2{-9} and the beginning of a downtrend, wave 3{-9}
Under the alternative analysis,
- A downtrend, wave 3{-9}, began overnight on January 15, at the point where wave 2{-9} ended with a high of 4028.25.
- Wave 3{-9} will have five subwaves — three trending and two upward corrections at the {-10} degree — and is presently in downtrending wave 1{-10}.
We Are Here.
These are the waves currently in progress under my principal analysis. Each line on the list shows the wave number, with the subscript in curly brackets, the traditional degree name, the starting date, the starting price of the S&P 500 E-mini futures, and the direction of the wave.
- S&P 500 Index:
- 5{+3} Supercycle, 7/8/1932, 4.40 (up)
- 5{+2} Cycle, 12/9/1974, 60.96 (up)
- 5{+1} Primary, 3/6/2009, 666.79 (up)
- 5{0} Intermediate, 12/26/2018, 2346.58 (up)
- 4{-1} Minor, 1/4/2022 4818.62 (down)
- 1{-2} Minute, 1/4/2022 4818.62 (down)
- S&P 500 Futures and index:
- 1{-3} Minuette, 1/4/2022, 4808.25 (down) (futures), 4818.62 (down) (index)
- S&P 500 Futures:
- 1{-4} Subminuette, 1/4/2022, 4808.25 (down)
- 1{-5} Micro, 1/4/2022, 4808.25 (down)
- 3{-6} Submicro, 8/16/2022, 4327.50 (down)
- 3{-7} Minuscule, 12/1/2022, 4110 (down)
- 1{-8} Subminuscule, 12/1/2022, 4110 (down)
Learning and other resources. Elliott wave analysis provides context, not prophecy. As the 20th century semanticist Alfred Korzybski put it in his book Science and Sanity (1933), “The map is not the territory … The only usefulness of a map depends on similarity of structure between the empirical world and the map.” And I would add, in the ever-changing markets, we can judge that similarity of structure only after the fact.
See the menu page Analytical Methods for a rundown on where to go for information on Elliott wave analysis.
By Tim Bovee, Portland, Oregon, January 17, 2023
Disclaimer
Tim Bovee, Private Trader tracks the analysis and trades of a private trader for his own accounts. Nothing in this blog constitutes a recommendation to buy or sell stocks, options or any other financial instrument. The only purpose of this blog is to provide education and entertainment.
No trader is ever 100 percent successful in his or her trades. Trading in the stock and option markets is risky and uncertain. Each trader must make trading decisions for his or her own account, and take responsibility for the consequences.
License
All content on Tim Bovee, Private Trader by Timothy K. Bovee is licensed under a Creative Commons Attribution-ShareAlike 4.0 International License.
Based on a work at www.timbovee.com.

You must be logged in to post a comment.