3:30 p.m. New York time
Half an hour before the closing bell. The price of the S&P 500 futures rose during the session, working their way from the overnight low, 3906.75, to the 3940s. The rise is a low-degree upward correction within a larger downtrend. Wave 3[-9} is underway and has much farther to go. I’ve updated the upper chart, showing the futures from early December to the present.
9:35 a.m. New York time
What’s happening now? The S&P 500 E-mini futures continued to fall in overnight trading, reaching a low of 3906.75 an hour before the opening bell.
What does it mean? The initial leg of a downtrend that began on January 17 continues.
What are the alternatives? Absolute confirmation that the downtrend has begun won’t occur until the price moves below 3803.50, the starting point of the upward correction that ended on January 17. Until that happens, here are the alternatives.
- Alternative #1: The decline now underway could be a subwave within the correction. Given the strength of the decline, I consider this alternative to be unlikely. However, a strong reversal to the upside would make this scenario more likely.
- Alternative #2: The upward correction may form a compound structure, containing two or three corrective patterns. If this is happening, then the first corrective pattern ended on January 17 and the decline is a connector wave, linking the first pattern to the future second pattern. The upward correction was the first correction within the downtrend that began on December 13, 2022. Usually compound structures happen in the second correction. So I think this alternative is unlikely, and an upward correction would increase its likelihood.
Chart note. The accountant who developed Elliott wave analysis in the 1930s, R.N. Elliott, understood that market prices form a fractal structure, although he never used the word “fractal”. Such structures are build from components containing smaller components that are also part of still larger components. And each part of the fractal puzzle shows the same patterns all the others.
The components on market charts are directional movements in price, and Elliott called such movements “waves”.
Each wave has a place within the fractal hierarchy, large to small. I designate that place with subscripts attached to the wave numbers, each contained within curly brackets. The higher the number, the higher the wave’s location within the fractal hierarchy. That location is called the wave’s degree.
I show a Fibonacci retracement ladder on the chart, in red. It shows the upward corretion’s retracement of the preceding downtrend. Under the principal analysis, the retracement ended at the 61.8% retracement level, and the decline that followed easily broke past the 38.2% retracement and is approaching the 23.6% retracement.
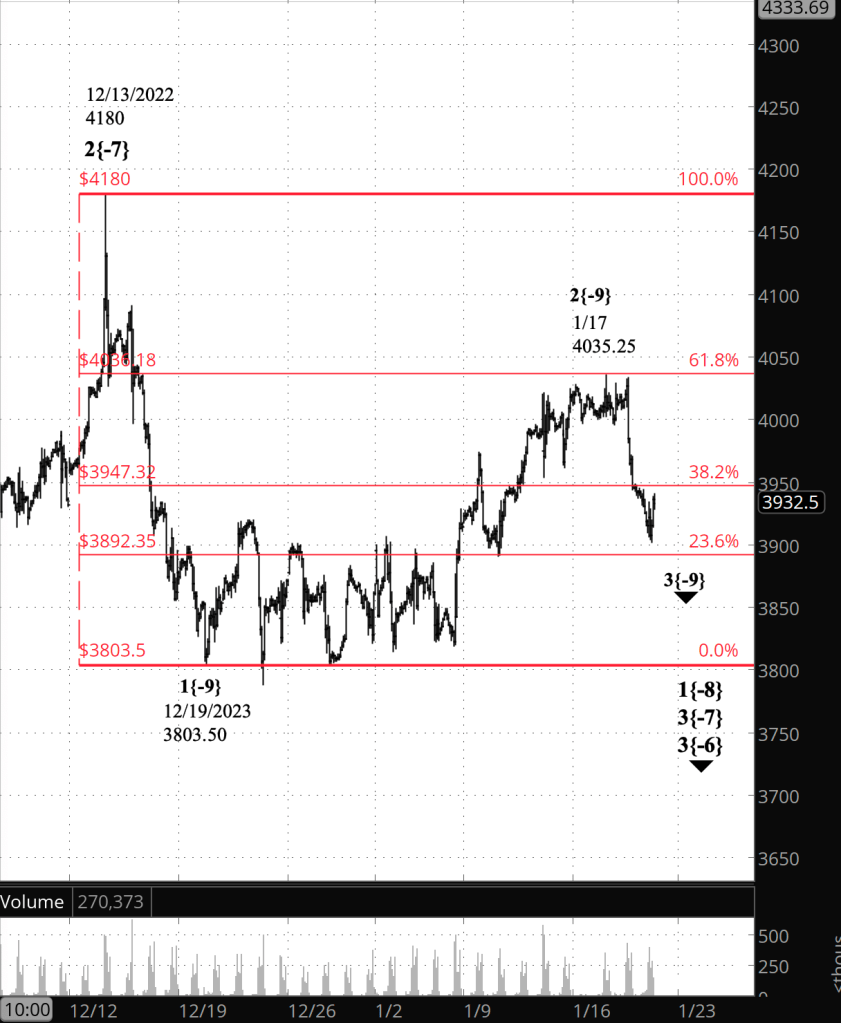
[S&P 500 E-mini futures at 3:30 p.m., 90-minute bars, with volume]
What does Elliott wave theory say? Here are Elliott waves for the three possible outcomes.
Under the principal analysis,
- The downtrend that began on January 17 is wave 3{-9}. Third waves tend to have a lot of power, and I expect wave 3{-9} to produce a significant decline.
- Wave 3{-9} is in its first subwave, 1{-10}, which when complete, will be followed by an upward correction, wave 2{-10}.
Under Alternative #1,
- The upward correction that began on December 19, 2022 is wave 2{-9}, and it is still underway.
- Internally, wave 2{-9} is in its final leg, rising wave E{-10}.
- When wave E{-10} is complete, it will also mark the end of wave 2{-9} and the start of a downtrend, wave 3{-9}.
Under Alternative #2,
- Wave 2{-9} is forming a compound structure. Compounding is unusual in second waves, but not entirely unheard of.
- The first correction structure ended on January 17.
- The downtrend that has follow is a wave that will connect the completed first corrective pattern with a second corrective pattern. That wave is labeled X{-10}.
Under all of the potential analyses,
- Wave 3{-9}, whenever it might begin, will have five subwaves of degree {-10}: Downtrending wave 1, an upward wave 2 correction, a downtrending wave 3, another upward correction labeled wave 4, and a final wave 5 push to the downside.
- Wave 2{-9} and wave 3{-9} are subwaves of wave 1{-8}, which began on December 13 and is a subwave of wave 3{-7}, an energetic downward correction.
- Wave 3{-7} is a subwave of a larger downtrend, wave 3{-6}.
- Wave 3{-6} is a subwave of a series of nested first waves of increasing size, up to wave 1{-2}, which began on January 4.
- Wave 1{-2} is a subwave of wave 4{-1}, the next to the last wave of an expanding Diagonal Triangle, wave 5{0}, that began on December 26, 2018.
- Wave 4{-1}may eventually approach the lower boundary of the triangle, presently in the 1850s and moving lower each day.
- Wave 4{-1} will be followed by uptrending wave 5{-1}, which will return to the upper boundary of the triangle, presently around 5900 and moving higher each day.
- Wave 5{-1} will be the final wave of wave 5{0}, the expanding Diagonal Triangle, which will also be the end of a series of fifth waves of increasing size and will be followed by a lengthy downtrend of larger size and duration than any within the memory of anyone now living.
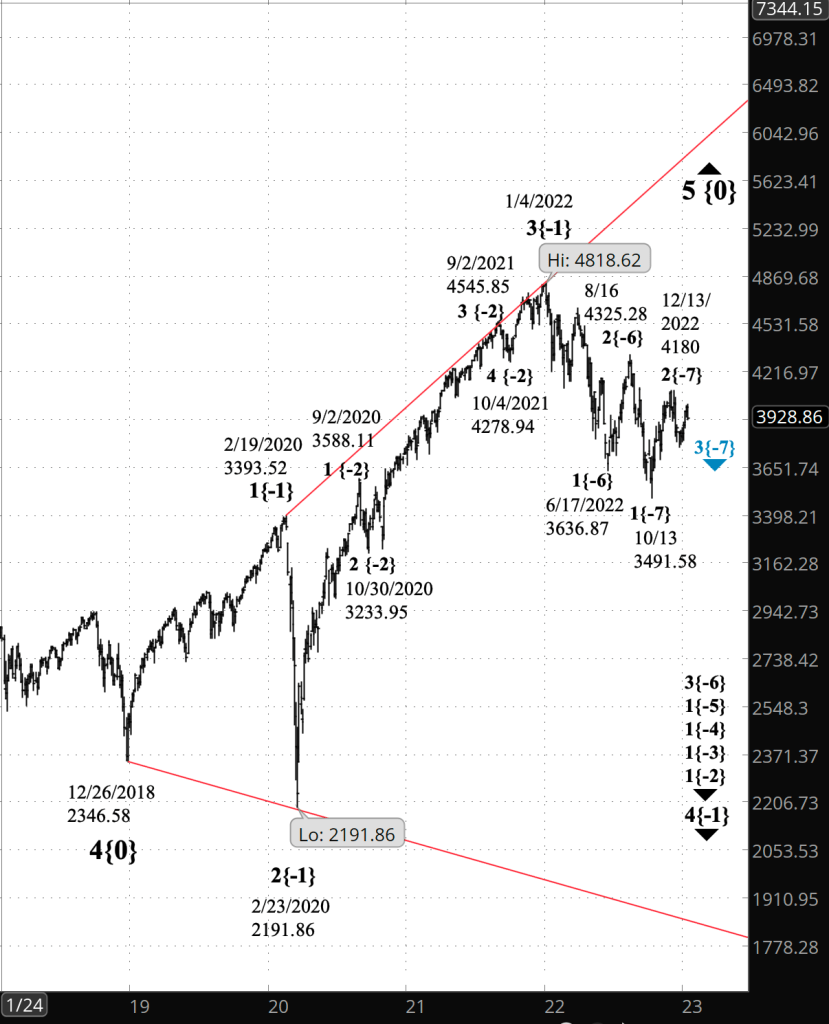
[S&P 500 index at 9:30 p.m., 3-day bars]
We Are Here.
These are the waves currently in progress under my principal analysis. Each line on the list shows the wave number, with the subscript in curly brackets, the traditional degree name, the starting date, the starting price of the S&P 500 E-mini futures, and the direction of the wave.
- S&P 500 Index:
- 5{+3} Supercycle, 7/8/1932, 4.40 (up)
- 5{+2} Cycle, 12/9/1974, 60.96 (up)
- 5{+1} Primary, 3/6/2009, 666.79 (up)
- 5{0} Intermediate, 12/26/2018, 2346.58 (up)
- 4{-1} Minor, 1/4/2022 4818.62 (down)
- 1{-2} Minute, 1/4/2022 4818.62 (down)
- S&P 500 Futures and index:
- 1{-3} Minuette, 1/4/2022, 4808.25 (down) (futures), 4818.62 (down) (index)
- S&P 500 Futures:
- 1{-4} Subminuette, 1/4/2022, 4808.25 (down)
- 1{-5} Micro, 1/4/2022, 4808.25 (down)
- 3{-6} Submicro, 8/16/2022, 4327.50 (down)
- 3{-7} Minuscule, 12/13/2022, 4110 (down)
- 1{-8} Subminuscule, 12/13/2022, 4110 (down)
Learning and other resources. Elliott wave analysis provides context, not prophecy. As the 20th century semanticist Alfred Korzybski put it in his book Science and Sanity (1933), “The map is not the territory … The only usefulness of a map depends on similarity of structure between the empirical world and the map.” And I would add, in the ever-changing markets, we can judge that similarity of structure only after the fact.
See the menu page Analytical Methods for a rundown on where to go for information on Elliott wave analysis.
By Tim Bovee, Portland, Oregon, January 19, 2023
Disclaimer
Tim Bovee, Private Trader tracks the analysis and trades of a private trader for his own accounts. Nothing in this blog constitutes a recommendation to buy or sell stocks, options or any other financial instrument. The only purpose of this blog is to provide education and entertainment.
No trader is ever 100 percent successful in his or her trades. Trading in the stock and option markets is risky and uncertain. Each trader must make trading decisions for his or her own account, and take responsibility for the consequences.
License
All content on Tim Bovee, Private Trader by Timothy K. Bovee is licensed under a Creative Commons Attribution-ShareAlike 4.0 International License.
Based on a work at www.timbovee.com.

You must be logged in to post a comment.