3:30 p.m. New York time
Half an hour before the closing bell. The S&P futures price continued to fall early in the session, to 3963.25, and the reversed, rising so far into the 4030s. No change in the analysis. I’ve updated the chart.
9:35 a.m. New York time
What’s happening now? The S&P 500 E-mini futures fell in overnight trading, reaching 3980.
What does it mean? An upward correction that began on December 22, 2022 is underway and is in its first of three segments. When the present first segment is complete, it will be followed by a declining second segment, and then by a third segment that once again pushes to the upside.
This principal analysis is based on a count that sees the first segment as having completed three of five subwaves.
What are the alternatives? I’m finding a lot of ambiguity in this chart, which has led to a several alternatives. The lower the price goes, the more likely one of the alternatives becomes.
Alternative #1: The first segment ended at the January 23 high, 4056.75. This scenario is based on a count of five complete subwaves, the expected count within the first wave within a Zigzag corrective pattern. This alternative requires that the price remain above 3785.50, the starting point of the upward correction.
Alternative #2: The third and final segment ended at the January 23 high, and with it the entire upward correction. The internal count since the correction began can be viewed as three complete subwaves. This scenario will be confirmed if the price moves below 3785.50, the starting point of the upward correction.
Chart notes. Segments, called “waves” in Elliott wave analysis, are labeled on the chart with numbers if they occur within trending waves and letters if they’re within corrective waves. The analysis is based on an understanding that no wave stands alone. Each wave is part of a larger wave and in turn contains smaller waves, all of which form the same sorts of patterns and follow the same rules. Each wave has a place within the hierarchy of nested waves, called a fractal hierarchy. I show the relative position of each wave with a subscript, contained within curly brackets, following the wave number. The smaller the subscript number, the lower in the hierarchy the wave.
The chart shows the S&P 500 futures from September 15, 2022 to the present.
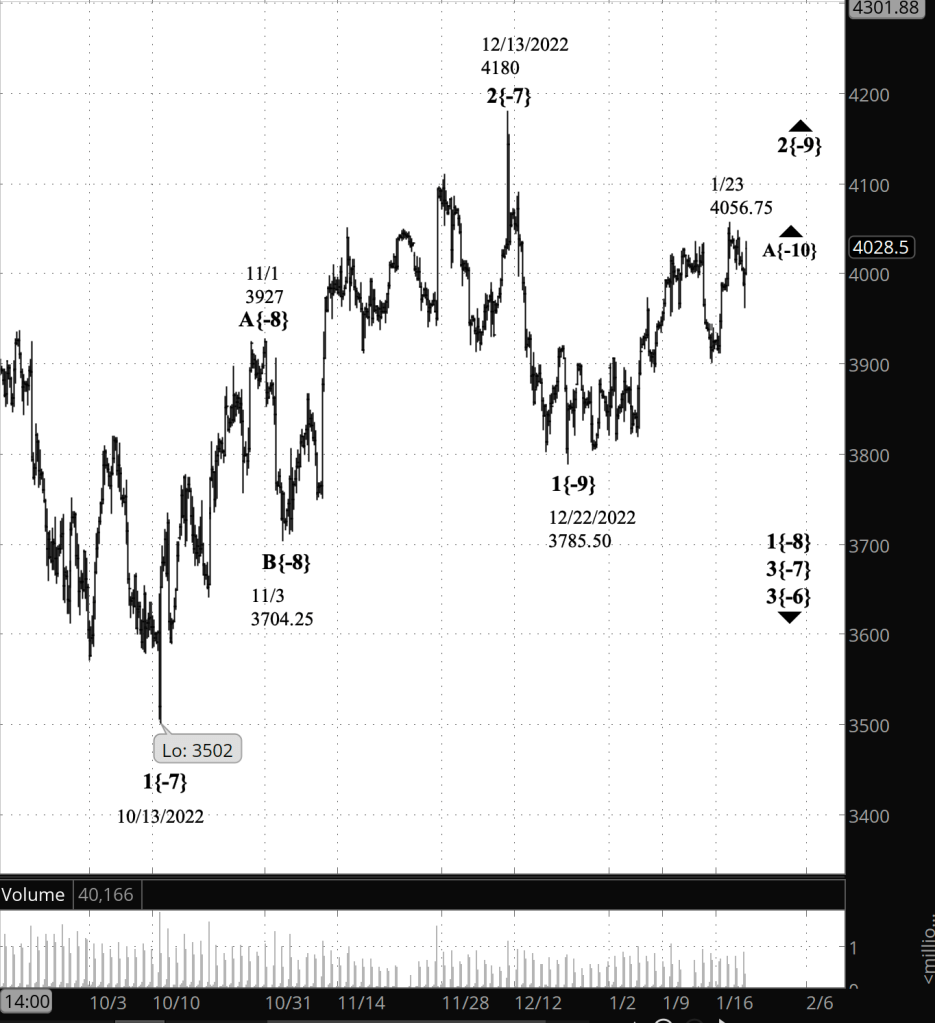
[S&P 500 E-mini futures at 3:30 p.m., 4-hour bars, with volume]
What does Elliott wave theory say? Here are the waves of the principal analysis and each alternative.
For all analyses, the upward correction is wave 2{-9}.
Principal analysis:
- Wave 2{-9} is in its first subwave, rising wave A{-10}. When complete, it will be followed by declining wave B{-10}.
Alternative #1:
- Wave A{-10} ended on January 23 at 4056.75 and declining wave B{-10} is underway. It will be followed by rising wave C{-10}, which will complete the wave 2{-9} upward correction.
Alternative #2:
- Wave C{-10} ended on January 23, and with it, the upward correction, wave 2{-9}. The decline that followed is downtrending wave 3{-9}, which will carry the price below 3785.50, the beginning of the upward correction, and most likely significantly below that level.
All scenarios are part of a larger set of waves:
- The upward correction, wave 2{-9}, is a subwave of downtrending wave 1{-8}, which began on December 13, 2022 from 4110.
- Wave 1{-8} is in turn a subwave of a series of declining waves, up to wave 4{-1}, which began on January 4, 2022 from 4808.25, the point where the present long-running bear market began.
- Wave 4{-1} is the next to the last wave within an expanding Diagonal Triangle that began on December 26, 2018. When the wave 4{-1} decline is complete, it will be followed by rising wave 5{-1}, which will carry the price above the January 4 high, 4808.25, and perhaps significantly above that level.
We Are Here.
These are the waves currently in progress under my principal analysis. Each line on the list shows the wave number, with the subscript in curly brackets, the traditional degree name, the starting date, the starting price of the S&P 500 E-mini futures, and the direction of the wave.
- S&P 500 Index:
- 5{+3} Supercycle, 7/8/1932, 4.40 (up)
- 5{+2} Cycle, 12/9/1974, 60.96 (up)
- 5{+1} Primary, 3/6/2009, 666.79 (up)
- 5{0} Intermediate, 12/26/2018, 2346.58 (up)
- 4{-1} Minor, 1/4/2022 4818.62 (down)
- 1{-2} Minute, 1/4/2022 4818.62 (down)
- S&P 500 Futures and index:
- 1{-3} Minuette, 1/4/2022, 4808.25 (down) (futures), 4818.62 (down) (index)
- S&P 500 Futures:
- 1{-4} Subminuette, 1/4/2022, 4808.25 (down)
- 1{-5} Micro, 1/4/2022, 4808.25 (down)
- 3{-6} Submicro, 8/16/2022, 4327.50 (down)
- 3{-7} Minuscule, 12/13/2022, 4110 (down)
- 1{-8} Subminuscule, 12/13/2022, 4110 (down)
Learning and other resources. Elliott wave analysis provides context, not prophecy. As the 20th century semanticist Alfred Korzybski put it in his book Science and Sanity (1933), “The map is not the territory … The only usefulness of a map depends on similarity of structure between the empirical world and the map.” And I would add, in the ever-changing markets, we can judge that similarity of structure only after the fact.
See the menu page Analytical Methods for a rundown on where to go for information on Elliott wave analysis.
By Tim Bovee, Portland, Oregon, January 25, 2023
Disclaimer
Tim Bovee, Private Trader tracks the analysis and trades of a private trader for his own accounts. Nothing in this blog constitutes a recommendation to buy or sell stocks, options or any other financial instrument. The only purpose of this blog is to provide education and entertainment.
No trader is ever 100 percent successful in his or her trades. Trading in the stock and option markets is risky and uncertain. Each trader must make trading decisions for his or her own account, and take responsibility for the consequences.
License
All content on Tim Bovee, Private Trader by Timothy K. Bovee is licensed under a Creative Commons Attribution-ShareAlike 4.0 International License.
Based on a work at www.timbovee.com.

You must be logged in to post a comment.