3:30 p.m. New York time
Half an hour before the closing bell. The S&P 500 futures rose during the session, reaching the 4070s and remaining below the January 26 high, 4109.25, which is the peak so far of the upward correction that began on December 22, 2022. No change in the analysis. I’ve updated the chart.
9:35 a.m. New York time
What’s happening now? The S&P 500 E-mini futures fell in overnight trading, reaching a low of 4007.50, and then reversed, rising back into the 4040s.
The decline brought the price below the 61.8% Fibonacci level, and a whipsaw brought it back above that resistance point. The rapid movement coincided with release of the 4th quarter Employment Cost Index, which, at 1%, was lower than the consensus expectation of 1.1% and the prior quarter result of 1.2%.
What does it mean? The upward correction that began on December 22 is nearing the end of its first segment. The 61.8% resistance level, 4029.30, is a key price in assessing the chart. If the futures stay above that level, then the principal analysis remains the most likely assessment. If price swiftly moves below that level, then the alternatives gain credence.
The correction’s first segment has reached a high of 4109.25 on January 26. A move above that level would discredit the alternative analyses.
What are the alternatives? There are two, both
Alternative #1: The first segment of the upward correction ended at the January 26 high. The declining second segment is now underway.
Alternative #2: The third and final segment ended at the January 26 high, and with it the entire upward correction. A downtrend is now underway and will carry the price below 3785.50, the starting point of the correction, and most likely significantly below that level.
Chart note. The chart continues to display the Fibonacci ladder for the upward correction — in red — showing the correction’s retracement of the downtrendng wave that preceded it.
The directional movements — “waves” — in Elliott wave analysis form a fractal structure, within which each wave contains smaller and is in turn contained by a larger wave. All waves, big and small, produce the same suite of patterns and follow the same rules.
To analyze a chart, each wave must be located within the fractal structure — which waves are contained by which larger waves, up and down the structure. In labeling this chart, I’ve given each wave a number for a subwave of trending waves and letter for a subwave of corrective waves. I designate the place within the fractal structure, the wave’s degree, with a subscript in curly brackets designating the wave’s relative size. The smaller the subscript number, the lower the wave’s degree.
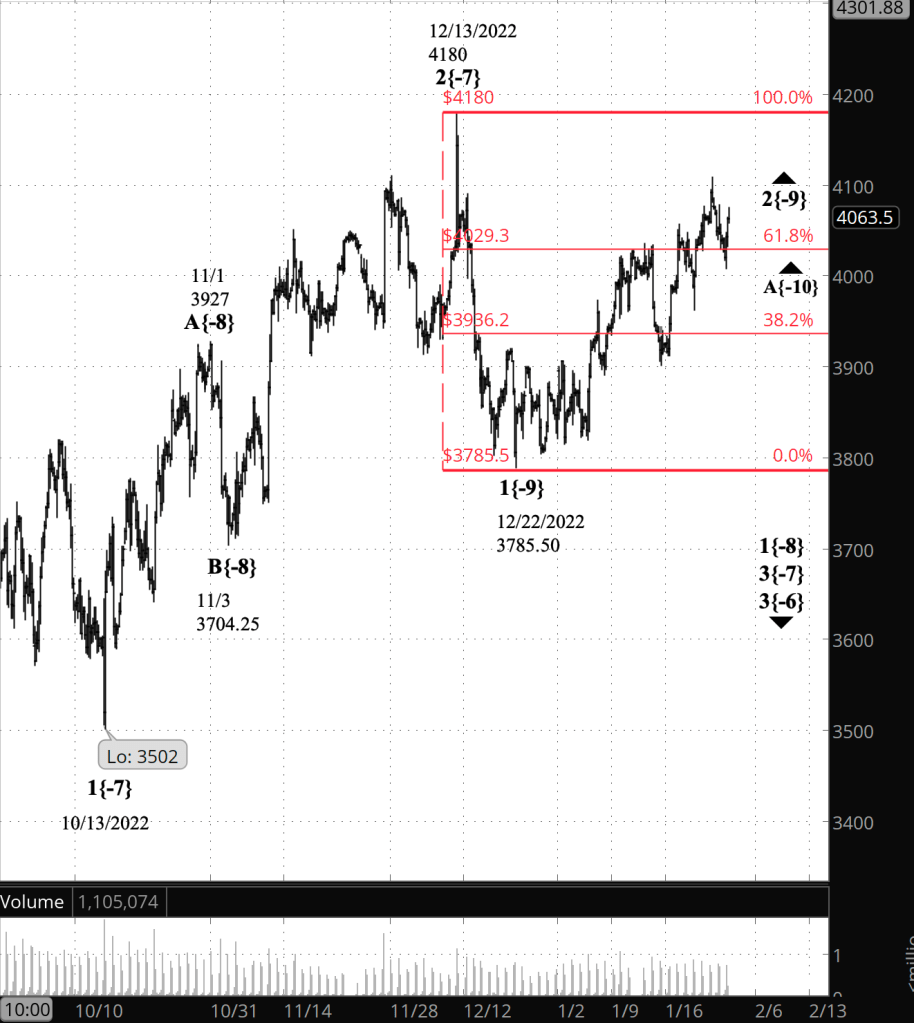
[S&P 500 E-mini futures at 3:30 p.m., 4-hour bars, with volume]
What does Elliott wave theory say? These are the waves I’m tracking in my analyses.
Principal analysis: The upward correction is wave 2{-9} and is nearing the end of its first subwave, wave A{-10}. The Fibonacci ladder on the chart tracks the wave 2{-9}’s retracement of the downtrending wave that preceded it, wave 1{-9}.
Analysis #1: Wave A{-10}, the first subwave of wave 2{-9}, ended on January 26. The second subwave, wave B{-10}, is now underway.
Analysis #2: Wave 2{-9} and its third and final subwave, wave C{-10} ended on January 26. Wave 3{-9}, a downtrend, is now underway.
The three analyses are playing out within wave 1{-8}, a downtrending wave with wave 2{-7}. Both began on December 13, 2022, from 4110. Those two waves, in turn, are subwaves of a nested series of downtrending waves of increasing size, up to wave 4{-1}, the next-to-the-last subwave of an expanding Diagonal Triangle, wave 5{0}, which began on December 26, 2018.
We Are Here.
These are the waves currently in progress under my principal analysis. Each line on the list shows the wave number, with the subscript in curly brackets, the traditional degree name, the starting date, the starting price of the S&P 500 E-mini futures, and the direction of the wave.
- S&P 500 Index:
- 5{+3} Supercycle, 7/8/1932, 4.40 (up)
- 5{+2} Cycle, 12/9/1974, 60.96 (up)
- 5{+1} Primary, 3/6/2009, 666.79 (up)
- 5{0} Intermediate, 12/26/2018, 2346.58 (up)
- S&P 500 Futures and index:
- 4{-1} Minor, 1/4/2022, 4808.25 (down) (futures), 4818.62 (down) (index)
- S&P 500 Futures:
- 1{-2} Minute, 1/4/2022, 4808.25 (down)
- 1{-3} Minuette, 1/4/2022, 4808.25 (down)
- 1{-4} Subminuette, 1/4/2022, 4808.25 (down)
- 1{-5} Micro, 1/4/2022, 4808.25 (down)
- 3{-6} Submicro, 8/16/2022, 4327.50 (down)
- 3{-7} Minuscule, 12/13/2022, 4110 (down)
- 1{-8} Subminuscule, 12/13/2022, 4110 (down)
Learning and other resources. Elliott wave analysis provides context, not prophecy. As the 20th century semanticist Alfred Korzybski put it in his book Science and Sanity (1933), “The map is not the territory … The only usefulness of a map depends on similarity of structure between the empirical world and the map.” And I would add, in the ever-changing markets, we can judge that similarity of structure only after the fact.
See the menu page Analytical Methods for a rundown on where to go for information on Elliott wave analysis.
By Tim Bovee, Portland, Oregon, January 31, 2023
Disclaimer
Tim Bovee, Private Trader tracks the analysis and trades of a private trader for his own accounts. Nothing in this blog constitutes a recommendation to buy or sell stocks, options or any other financial instrument. The only purpose of this blog is to provide education and entertainment.
No trader is ever 100 percent successful in his or her trades. Trading in the stock and option markets is risky and uncertain. Each trader must make trading decisions for his or her own account, and take responsibility for the consequences.
License
All content on Tim Bovee, Private Trader by Timothy K. Bovee is licensed under a Creative Commons Attribution-ShareAlike 4.0 International License.
Based on a work at www.timbovee.com.

You must be logged in to post a comment.