3:30 p.m. New York time
Half an hour before the closing bell. The S&P 500 futures rose during the session, to 4208.50, and then pulled back, into the 4150s.
The upward correction that began on October 13, 2022 continues and is in its last segment, which began on December 22, 2022. That last segment, in turn, is in its middle portion, meaning more upside potential remains.
As an alternative, the session high could mark the end of the correction’s final segment and of the correction itself. Under this scenario, the subsequent decline is the start of a significant downtrend.
In Elliott wave terminology, the upward correction, wave 2{-7}, is still underway and is in its final subwave, wave C{-8}, which is in its middle wave of five, wave C{-9}.
Under the alternative analysis, the session high may mark the end of wave C{-8} and of the wave 2{-7}. I consider this scenario to be unlikely because the wave structure within wave C{-8}, at the {-9} degree, shows it has further to go before reaching its end.
The chart I posted at 11:50 a.m. had an error, showing wave B{-9} twice. I’ve corrected it to show that the present rise is wave C{-9}.
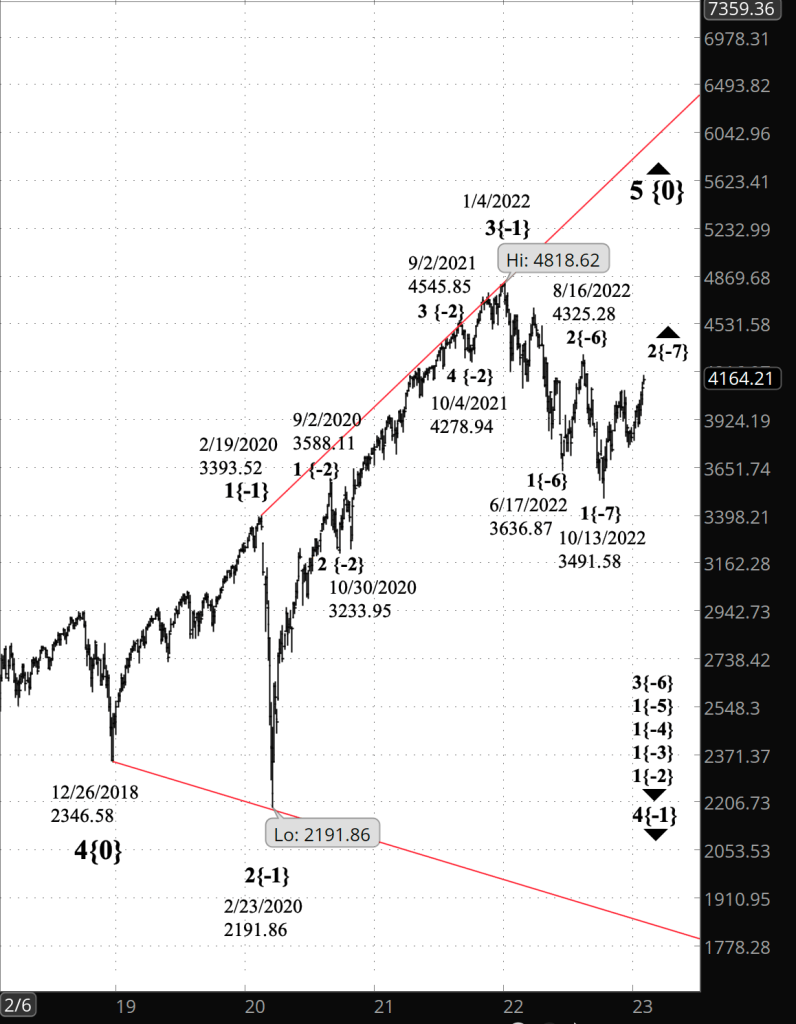
Although what is happening today looks large, it’s fairly small in comparison to wave 4{-1}, the downward movement that began on January 4, 2022, and even smaller in comparison to the vast expanding Diagonal Triangle, wave 5{0}, that encompasses all that is happening at present. Wave 5{0} began its work on December 26, 2018.
So today’s drama is but a momentary rush within a far larger saga.
[S&P 500 index at 3:25 p.m., 3-day bars]
The top chart, newly added, shows the entirety of the expanding Diagonal Triangle so far, using the S&P 500 index. It is labeled with the revised analysis.
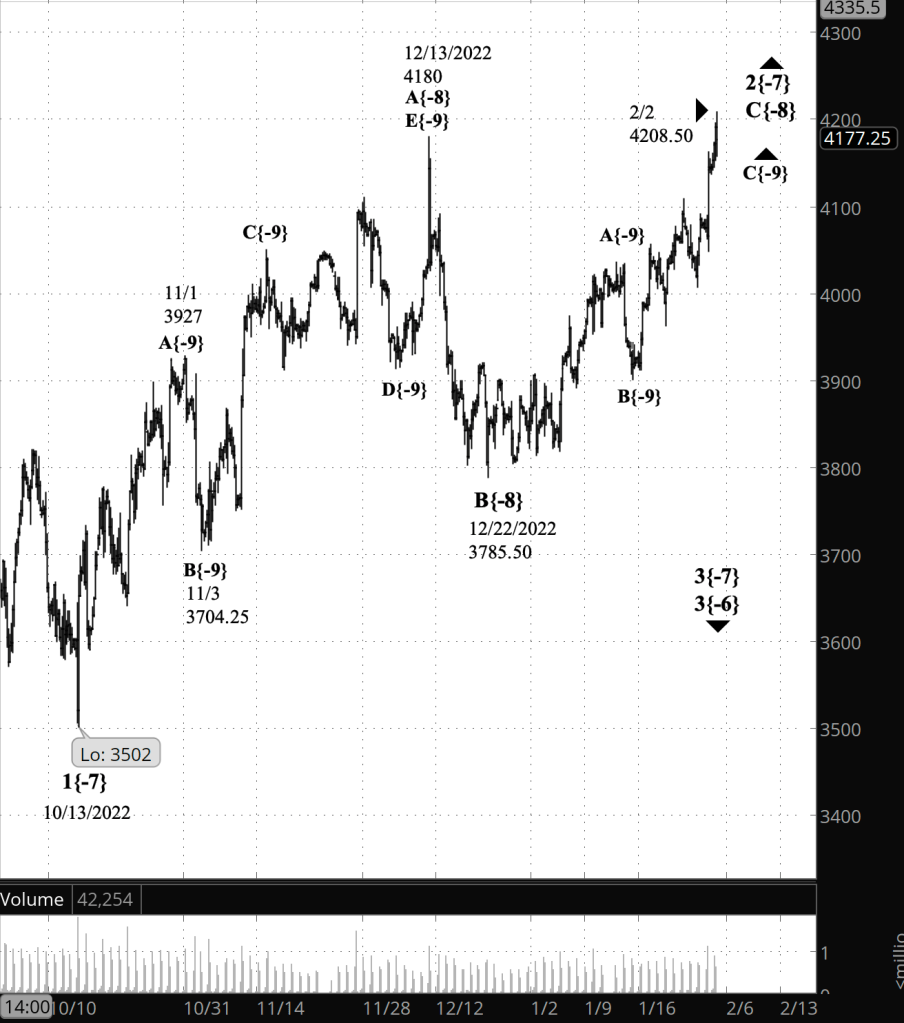
The middle chart, initially posted at 11:30 a.m. and updated for this posting, shows the S&P 500 futures, including the upward correction and the downtrend that preceded it, labeled with the revised analysis.
The lower chart, posted at 9:35 a.m., shows the S&P 500 futures labeled with the former, now superseded analysis and has not been updated.
11:50 a.m. New York time
Chart reanalyzed. The S&P 500 futures moved above 4180 at the opening bell, invalidating the analysis of this morning and stretching back to late December. Here is the new analysis.
What’s happening now (revised). The futures rose into the 4190s early in the session.
What does it mean (revised)? An upward correction that began on October 13, 2022 is underway and is in its third and final segment.
What are the alternatives (revised)? There are alternatives, but I have more analysis to do before I’ve nailed them down. Tomorrow…
Chart note (revised). This chart shows the revised analysis. I’ve retained the former, now invalid, analysis from this morning.
[S&P 500 E-mini futures at 3:30 p.m., 4-hour bars, with volume]
What does Elliott wave analysis say (revised)? These are the waves that I’m tracking under the revised analysis.
Principal analysis: The upward correction, wave 2{-7}, began on October 13, 2022 from 3502. It is now in its third subwave, wave C{-8}. When wave C{-8} is complete, it will also be the end of the upward correction, wave 2{-7}, which will be followed by a significant downtrend, wave 3{-7}, which will carry the price down to 3502, the starting point of the upward correction, and likely significantly below that level.
9:35 a.m. New York time
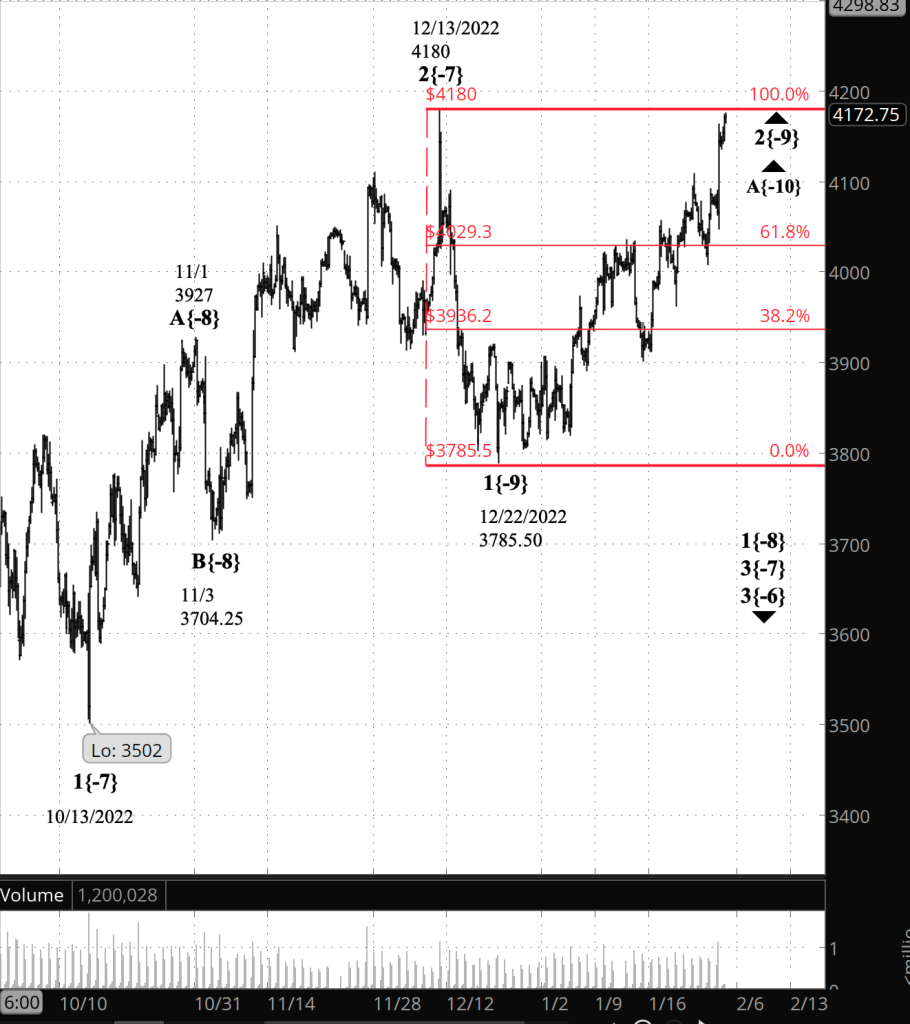
What’s happening now? The S&P 500 E-mini futures rose overnight, reaching a high of 4176.25 so far.
What does it mean? The upward correction that began on December 22, 2022 continues. Under that scenario, the highest the price can rise at this point is 4180. Any movement above that point would invalidate the analysis that follows and would require a major reanalysis.
The yet unanswered question about today’s high is what it represents: The peak of the first segment of the upward correction, or of the correction as a whole. The principal analysis this morning continues to show it as being the end of the first segment of the correction.
What are the alternatives? There are two.
- Alternative #1: The first segment of the upward correction, wave A{-10}, ended at the overnight high. The declining second segment, wave B{-10}, will follow.
- Alternative #2: The third and final segment ended at the overnight high, and with it the entire upward correction. A downtrend is now underway and will carry the price below 3785.50, the starting point of the correction, and most likely significantly below that level.
If the price moves above 4180, the revised analysis would look something like this:
- The December 13 peak becomes the first segment of an upward correction that began on October 13, 2022.
- The decline that followed becomes the second segment of that correction, still underway.
- The upward correction follows a downtrending wave that began on August 16, 2022 from 4327.50.
Chart note. I’ve placed a Fibonacci ladder on the chart, in red, showing how close the price has come to a 100% retracement of the downtrend the preceded the correction.
Directional movements — “waves” in the parlance of Elliott wave analysis — form a fractal pattern of smaller waves within larger waves, which in turn are building blocks of still larger waves. A wave’s position in the fractal hierarchy is called its “degree”. I show each wave’s degree with a numerical subscript within curly brackets. The smaller the subscript’s number, the smaller the degree. The chart shows relatively small waves, lasting for months rather than years, and so the subscript’s are negatives.
The following chart is from an earlier analysis, which has been replaced by a new analysis. See the chart above.
[S&P 500 E-mini futures at 9:35 a.m., 4-hour bars, with volume]
What does Elliott wave theory say? The waves I’m tracking are unchanged from yesterday, and their description, below, is only slightly modified.
Principal analysis: The upward correction is wave 2{-9} and is nearing the end of its first subwave, wave A{-10}. The Fibonacci ladder on the chart tracks the wave 2{-9}’s retracement of the downtrending wave that preceded it, wave 1{-9}.
Analysis #1: Wave A{-10}, the first subwave of wave 2{-9}, ended at today’s high. The second subwave, wave B{-10}, is now underway.
Analysis #2: Wave 2{-9} and its third and final subwave, wave C{-10} ended at today’s high. Wave 3{-9}, a downtrend, is now underway.
The three analyses are are all happening within wave 1{-8}, a downtrending wave with wave 2{-7}. Both began on December 13, 2022, from 4110. Those two waves, in turn, are subwaves of a nested series of downtrending waves of increasing size, up to wave 4{-1}, the next-to-the-last subwave of an expanding Diagonal Triangle, wave 5{0}, which began on December 26, 2018.
A reanalysis, should it become necessary, will have these waves:
- The December 13, 2022 peak at 4180, now the end of wave 2{-7}, becomes the end of wave A{-8}, the first segment of an upward correction that began on October 13, 2022. Wave 2{-7} is still underway.
- Declining wave B{-8} is now underway and is the second segment of the correction.,
- The upward correction is a subwave of downtrending wave 3{-6}, which began on August 16, 2022 from 4327.50.
We Are Here.
These are the waves currently in progress under my principal analysis. Each line on the list shows the wave number, with the subscript in curly brackets, the traditional degree name, the starting date, the starting price of the S&P 500 E-mini futures, and the direction of the wave.
- S&P 500 Index:
- 5{+3} Supercycle, 7/8/1932, 4.40 (up)
- 5{+2} Cycle, 12/9/1974, 60.96 (up)
- 5{+1} Primary, 3/6/2009, 666.79 (up)
- 5{0} Intermediate, 12/26/2018, 2346.58 (up)
- S&P 500 Futures and index:
- 4{-1} Minor, 1/4/2022, 4808.25 (down) (futures), 4818.62 (down) (index)
- S&P 500 Futures:
- 1{-2} Minute, 1/4/2022, 4808.25 (down)
- 1{-3} Minuette, 1/4/2022, 4808.25 (down)
- 1{-4} Subminuette, 1/4/2022, 4808.25 (down)
- 1{-5} Micro, 1/4/2022, 4808.25 (down)
- 3{-6} Submicro, 8/16/2022, 4327.50 (down)
- 2{-7} Minuscule, 10/13/2022, 3502 (up)
Learning and other resources. Elliott wave analysis provides context, not prophecy. As the 20th century semanticist Alfred Korzybski put it in his book Science and Sanity (1933), “The map is not the territory … The only usefulness of a map depends on similarity of structure between the empirical world and the map.” And I would add, in the ever-changing markets, we can judge that similarity of structure only after the fact.
See the menu page Analytical Methods for a rundown on where to go for information on Elliott wave analysis.
By Tim Bovee, Portland, Oregon, February 2, 2023
Disclaimer
Tim Bovee, Private Trader tracks the analysis and trades of a private trader for his own accounts. Nothing in this blog constitutes a recommendation to buy or sell stocks, options or any other financial instrument. The only purpose of this blog is to provide education and entertainment.
No trader is ever 100 percent successful in his or her trades. Trading in the stock and option markets is risky and uncertain. Each trader must make trading decisions for his or her own account, and take responsibility for the consequences.
License
All content on Tim Bovee, Private Trader by Timothy K. Bovee is licensed under a Creative Commons Attribution-ShareAlike 4.0 International License.
Based on a work at www.timbovee.com.

You must be logged in to post a comment.