3:30 p.m. New York time
Half an hour before the closing bell. The S&P 500 futures rose sharply after Fed Chair Jerome Powell began speaking during an interview at The Economic Club of Washington, D.C. The price had hit a session low half an hour earlier, 4098.25, and then took off, so far reaching into the 4170s. The price so far has remained below 4208.50, the high point of the upward correction now underway.
The swift rise suggests that the next-to-the-last segment of the final leg of the correction, which began on October 13, 2022, ended at today’s low, and the final segment within the final leg is now underway. A rise past 4208.50 will confirm that analysis.
In Elliott wave analysis terminology, downward wave D{-9} ended today at 4098.25 and upward wave E{-9} has begun. A rise above the starting point of wave D{-9} — 4208.50 — will confirm that analysis. The end of wave E{-9} will also mark the end of its parent, wave C{-8}, and of the upward correction, wave 2{-7}. Downtrending wave 3{-7} will follow and will carry the price below 3502, the starting point of wave 2{-7}, and most likely significantly below that level.
An alternative analysis would have it that wave D{-9} is still underway and today’s rise is a subwave of the continuing downward movement.
I’ve updated the chart to show the revised analysis.
9:35 a.m. New York time
What’s happening now? The S&P 500 E-mini futures continued trading narrowly overnight, ranging from the 4110s to the 4130s. At the opening bell it briefly moved below 4110
What does it mean? The futures continue to trace out an upward correction that began on October 13, 2022. The final leg of the correction began on December 22, 2022. That final leg is in turn in its next-to-the-last segment, a downward movement, which may well have ended with the February 6 low of 4104. If that segment has indeed ended, then the rising, final segment of the final leg of the correction is now underway.
The end of the final segment will also be the end of the last leg of the correction and of the correction itself. A powerful downtrend will then begin.
What are the alternatives? The wave count within the final segment lacks clarity. It’s quite possible that the downward movement is still underway.
Chart notes. Each wave — directional movement — has a number (for subwaves within trends) or a letter (for subwaves within corrections). Each wave has a subscript, in curly brackets, to indicate the wave’s place, its degree, within the fractal structure of the price movements. This chart is tracking relatively small waves and so the subsceripts are negative numbers. The smaller the number, the smaller the degree.
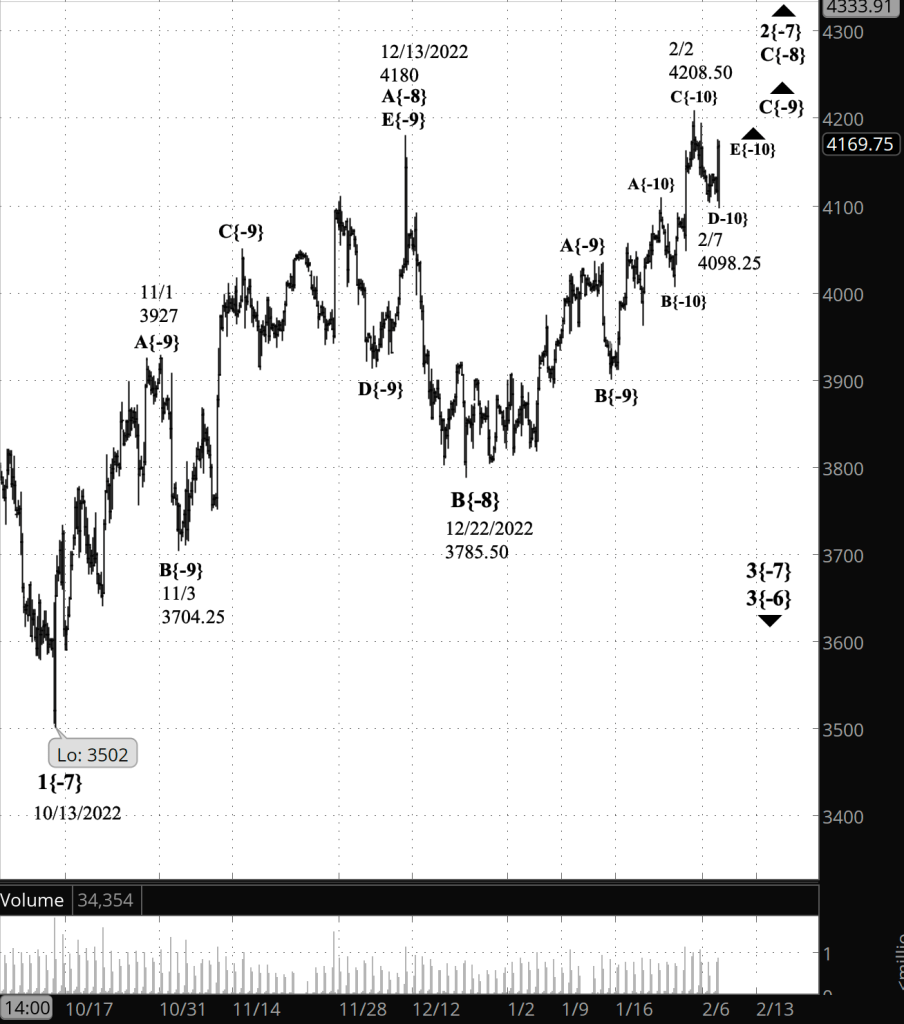
[S&P 500 E-mini futures at 3:30 p.m., 4-hour bars, with volume]
What does Elliott wave theory say? Here are the waves that are important to the analysis.
Principal analysis:
- The downward correction is wave 2{-7}.
- The last leg of that correction is upward wave C{-8}.
- The next-to-the-last segment within that last leg is wave D{-9}. It may have ended on February 6.
- If the D wave has indeed ended, rising wave E{-9} is now underway and will likely exceed 4208.50, the D-wave’s starting point.
Alternative analysis:
- There’s an equal likelihood that wave D{-9} is still on its downward journey.
So how do we distinguish between the two scenarios?
Wave D{-9} will have three waves internally, and there appear to be three waves on the chart. That’s the basis of the principal analysis, that wave D{-9} is complete and wave E{-9} has begun.
And yet, the first and second subwaves within D{-9}, which are waves A{-10} and B{-10}, are rather small reversals that happened very quickly and lack clear internal detail even on a five-minute chart. That leaves open the possibility that A{-10} and B{-10} are instead movements of a smaller degree, perhaps the {-11}th degree.
A rise closer to the 4180s would strengthen the case for the principal analysis. A fall below 4000 would strengthen the case for the alternative.
Both scenarios:
- Everything described above is happening within wave 3{-6}, which began on August 16, 2022.
- Wave 3{-6} is encompassed by a series of larger waves, the smaller within the larger, stretching up five degrees to wave 4{-1}, which began on January 4, 2022.
- Wave 4{-1} is the next-to-the-last wave within a large expanding Diagonal Triangle, wave 5{0}, that began on December 26, 2018.
And there’s more. See the “We Are Here” list of current waves, below.
We Are Here.
These are the waves currently in progress under my principal analysis. Each line on the list shows the wave number, with the subscript in curly brackets, the traditional degree name, the starting date, the starting price of the S&P 500 E-mini futures, and the direction of the wave.
- S&P 500 Index:
- 5{+3} Supercycle, 7/8/1932, 4.40 (up)
- 5{+2} Cycle, 12/9/1974, 60.96 (up)
- 5{+1} Primary, 3/6/2009, 666.79 (up)
- 5{0} Intermediate, 12/26/2018, 2346.58 (up)
- S&P 500 Futures and index:
- 4{-1} Minor, 1/4/2022, 4808.25 (down) (futures), 4818.62 (down) (index)
- S&P 500 Futures:
- 1{-2} Minute, 1/4/2022, 4808.25 (down)
- 1{-3} Minuette, 1/4/2022, 4808.25 (down)
- 1{-4} Subminuette, 1/4/2022, 4808.25 (down)
- 1{-5} Micro, 1/4/2022, 4808.25 (down)
- 3{-6} Submicro, 8/16/2022, 4327.50 (down)
- 2{-7} Minuscule, 10/13/2022, 3502 (up)
Learning and other resources. Elliott wave analysis provides context, not prophecy. As the 20th century semanticist Alfred Korzybski put it in his book Science and Sanity (1933), “The map is not the territory … The only usefulness of a map depends on similarity of structure between the empirical world and the map.” And I would add, in the ever-changing markets, we can judge that similarity of structure only after the fact.
See the menu page Analytical Methods for a rundown on where to go for information on Elliott wave analysis.
By Tim Bovee, Portland, Oregon, February 7, 2023
Disclaimer
Tim Bovee, Private Trader tracks the analysis and trades of a private trader for his own accounts. Nothing in this blog constitutes a recommendation to buy or sell stocks, options or any other financial instrument. The only purpose of this blog is to provide education and entertainment.
No trader is ever 100 percent successful in his or her trades. Trading in the stock and option markets is risky and uncertain. Each trader must make trading decisions for his or her own account, and take responsibility for the consequences.
License
All content on Tim Bovee, Private Trader by Timothy K. Bovee is licensed under a Creative Commons Attribution-ShareAlike 4.0 International License.
Based on a work at www.timbovee.com.

You must be logged in to post a comment.