3:30 p.m. New York time
Half an hour before the closing bell. The S&P 500 futures rose during the session back into the 3980s, taking a form that implied a low-degree upward correction within a larger downward movement (3 waves, A-C, with this subwave pattern: A:3, B:3, C:5. This morning’s analysis is unchanged. I’ve updated the upper chart.
9:35 a.m. New York time
What’s happening now? The S&P 500 E-mini futures had a downward slope in overnight trading until the inflation metric from the GDP was released. Inflation rose. The S&P 500 futures fell, by 25 points in 15 minutes, into the 3960s.
What does it mean? In a large downtrend, all news is bad news, and the present downtrend, which began on February 2, is no exception. The downtrend is still in its early stage and will eventually carry the price below 3502, most likely significantly below that level. The downtrend begun this month is a building block within a nested series of downtrends of increasing size, stretching back to the downtrend that began on January 4, 2022, from 4808.25.
What is the alternative? The downtrend so far has retraced 35% of the rising correction that preceded it. It has some distance to go before reacing the correction’s starting point at 3502 on October 13, 2022.
Nonetheless, one alternative is that the upward correction is still underway and the present downward movement is a subcomponent of that correction. The price the goes, the less likely this scenario becomes. Nonetheless, it’s a possible interpretation that doesn’t break any of the rules of Elliott wave analysis. A decline below 3502 would take this scenario off the table.
Chart note. I’ve moved the chart out for a broader view, showing the upward correction that began on October 13, 2022 and the downtrened that began last February 2. The chart vividly illustrates just how much downward potential there is. I’ve posted a second even longer-term chart in the Elliott wave theory section, below.
A note on the complex labeling system on the chart that shows the Elliott wave analysis, a necessity given the fractal nature of stock movements. Under the labeling system, each wave — a directional price movement — has a designation — a number or letter — that shows its position within the larger structure that contains it. And each wave designation is followed by a subscript, in curly brackets, to indicate the wave’s place, its degree, within the complete fractal structure of the price movements.
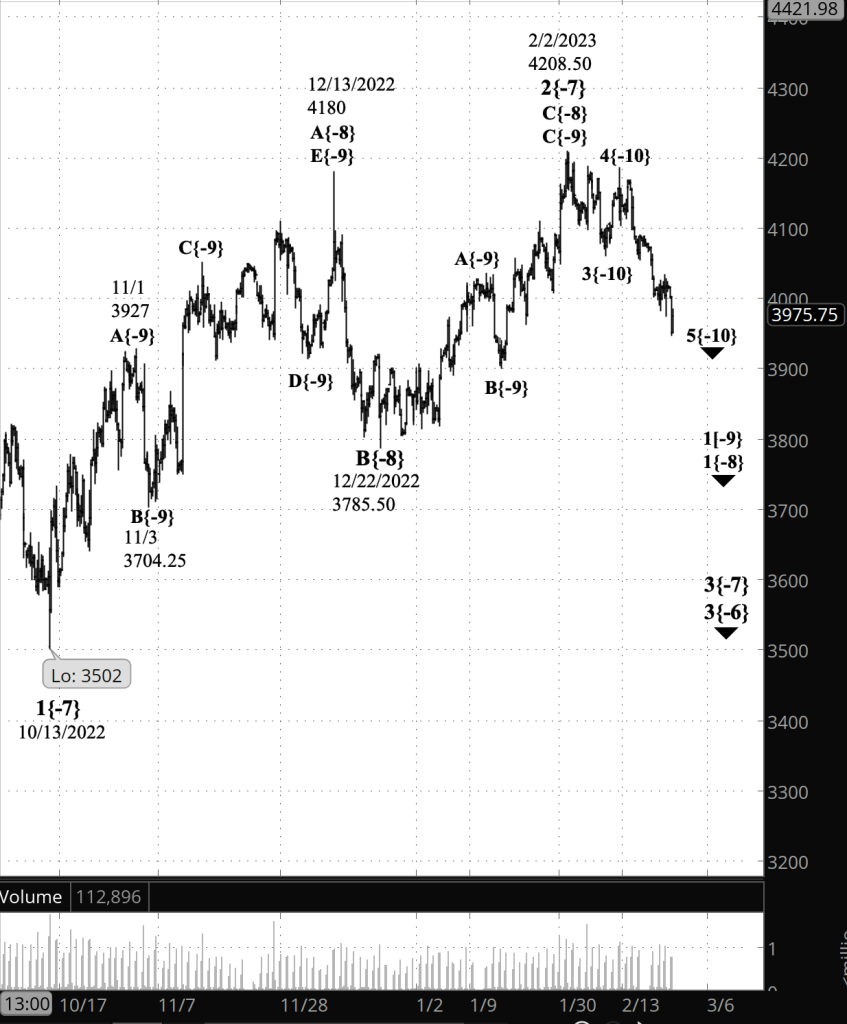
[S&P 500 E-mini futures at 9:35 a.m., 5-hour bars, with volume]
What does Elliott wave theory say? Here are the key waves that inform my analyses.
Principal analysis:
- The downward correction that began on February 2, wave 3{-7}, continues.
- It is working through the first of five subwaves, wave 1{-8}.
- Within wave 1{-8}, wave 1{-9} is underway and is in the final subwave within a five-wave structure, downtrending wave 5{-10}.
- Wave 3{-7} is still taking its tentative first steps and will develop into a powerful downtrend that will carry the price below 3502, the starting point of the preceding upward correction, wave 2{-7}, and most likely significantly below that level.
- The preceding wave, an upward correction, is wave 2{-7}, which began on October 13, 2022 and ended on February 2.
Alternative analysis;
- The upward correction that began on October 13, 2022, wave 2{-7}, is still underway.
- It is in the third of three parts, upward wave C{-8}.
- C{-8} in turn is in its third and final subwave, rising wave C{-9}.
- Wave 3{-7} will follow, a powerful downtrend that will carry the price below the starting point of the correction, 3502, and most likely significantly below that level.
Confirmation signals.
The principal analysis will be confirmed if the present decline, wave 3{-7} and its subwaves move below 3502.
Alternative analysis #1 will be confirmed if the price reverses and moves above 4208.50.
Bigger structures:
- This is all happening within wave 3{-6}, which began on August 16, 2022.
- Wave 3{-6} is encompassed by a series of larger waves, the smaller within the larger, stretching up five degrees to wave 4{-1}, which began on January 4, 2022.
- Wave 4{-1} is the next-to-the-last wave within a large expanding Diagonal Triangle, wave 5{0}, that began on December 26, 2018
The chart below covers the S&P 500 index from late 2018, the starting point of the expanding Diagonal Triangle now underway, to the present. The red lines are price channels, showing the boundaries of the Triangle as defined by the beginning and end points of the internal waves. The crash early in the pandemic is wave 2{-1} on the chart. The rise to January 4, 2022 labeled wave 3{-1}, and the present downtrend, as wave 4[-1}. The present downtrend potentially could carry the price down to the lower boundary of the price channel, which is presently in the 1840s and falling further each day.
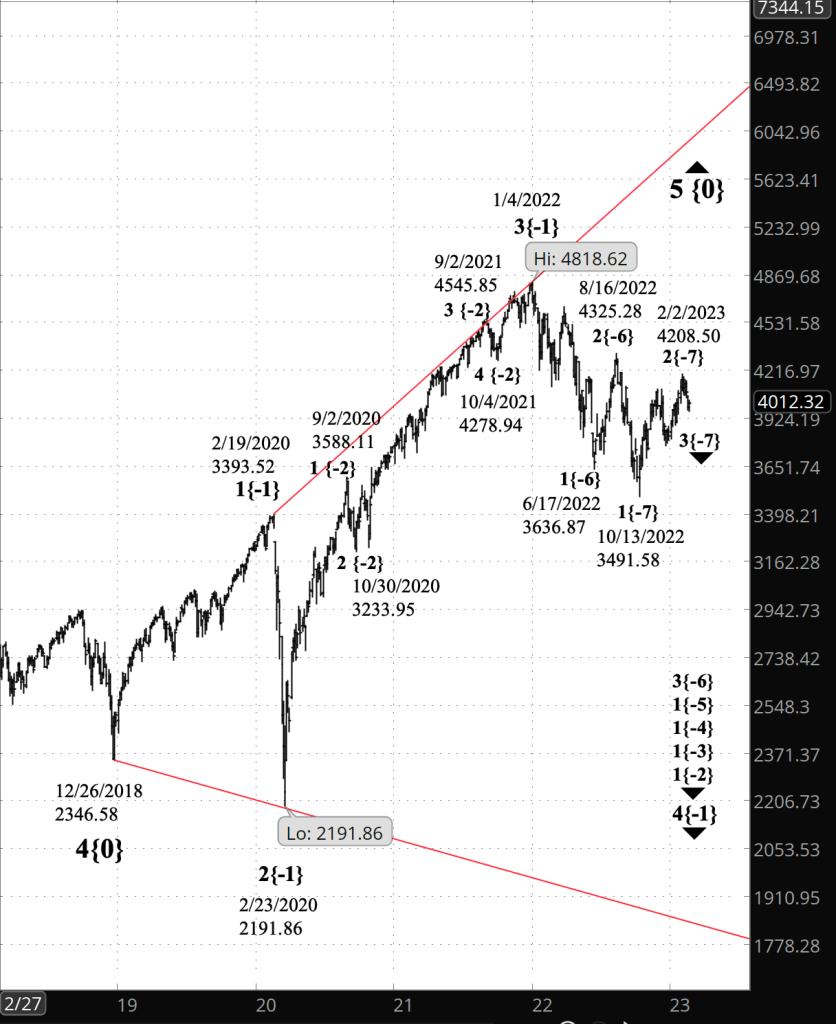
[S&P 500 index at 9:25 a.m., 3-day bars, with volume]
We Are Here.
These are the waves currently in progress under my principal analysis. Each line on the list shows the wave number, with the subscript in curly brackets, the traditional degree name, the starting date, the starting price of the S&P 500 E-mini futures, and the direction of the wave.
- S&P 500 Index:
- 5{+3} Supercycle, 7/8/1932, 4.40 (up)
- 5{+2} Cycle, 12/9/1974, 60.96 (up)
- 5{+1} Primary, 3/6/2009, 666.79 (up)
- 5{0} Intermediate, 12/26/2018, 2346.58 (up)
- S&P 500 Futures and index:
- 4{-1} Minor, 1/4/2022, 4808.25 (down) (futures), 4818.62 (down) (index)
- S&P 500 Futures:
- 1{-2} Minute, 1/4/2022, 4808.25 (down)
- 1{-3} Minuette, 1/4/2022, 4808.25 (down)
- 1{-4} Subminuette, 1/4/2022, 4808.25 (down)
- 1{-5} Micro, 1/4/2022, 4808.25 (down)
- 3{-6} Submicro, 8/16/2022, 4327.50 (down)
- 3{-7} Minuscule, 2/2/2023, 4208.50 (down)
Learning and other resources. Elliott wave analysis provides context, not prophecy. As the 20th century semanticist Alfred Korzybski put it in his book Science and Sanity (1933), “The map is not the territory … The only usefulness of a map depends on similarity of structure between the empirical world and the map.” And I would add, in the ever-changing markets, we can judge that similarity of structure only after the fact.
See the menu page Analytical Methods for a rundown on where to go for information on Elliott wave analysis.
By Tim Bovee, Portland, Oregon, February 24, 2023
Disclaimer
Tim Bovee, Private Trader tracks the analysis and trades of a private trader for his own accounts. Nothing in this blog constitutes a recommendation to buy or sell stocks, options or any other financial instrument. The only purpose of this blog is to provide education and entertainment.
No trader is ever 100 percent successful in his or her trades. Trading in the stock and option markets is risky and uncertain. Each trader must make trading decisions for his or her own account, and take responsibility for the consequences.
License
All content on Tim Bovee, Private Trader by Timothy K. Bovee is licensed under a Creative Commons Attribution-ShareAlike 4.0 International License.
Based on a work at www.timbovee.com.

You must be logged in to post a comment.