3:30 p.m. New York time
Half an hour before the closing bell. The S&P 500 futures spent the session in a net sideways movement, fluctuating between the 3970s and a few points above 4000. The waves discussed in this morning’s analysis continue: A small upward correction, wave 4{-12}, within a much larger downtrend, wave 3{-7}. I’ve updated the chart.
1:20 p.m. New York time
RIVN earnings play entry. I’ve entered a bear call vertical spread on RIVN, using options that trade for the last time 52 days from now, and have posted an analysis of the trade.
9:35 a.m. New York time
What’s happening now? The S&P 500 E-mini futures fell overnight to 3972.25 and then reversed, reaching 4003.75 before reversing again, back to the 3970s so far.
What does it mean? The relatively small upward correction that began February 22 continues and is in the second of three internal segments. It is part of a downtrend that began on February 2. That larger downtrend will reach below 3502 and most likely significantly below that level.,
What are the alternatives? It’s possible that a downtrending subwave of the February 2 decline, one that began on February 14, ended at the February 22 low. If that proves to be the case, then the upward correction will be larger than the principal analysis expects.
Reading the chart. I’ve superimposed a Fibonacci retracement ladder on the chart, in read, making it easier to see when the price reaches the levels that are often reversal points. So far the price has reached, and reversed from, the 38.2% retracement level, the smallest of the major levels.
The labeling system on the chart that shows the Elliott wave analysis. It is complex, a necessity given the fractal nature of stock movements. Under the labeling system, each wave — a directional price movement — has a designation — a number or letter — that shows its position within the larger structure that contains it. And each wave designation is followed by a subscript, in curly brackets, to indicate the wave’s place, its degree, within the complete fractal structure of the price movements.
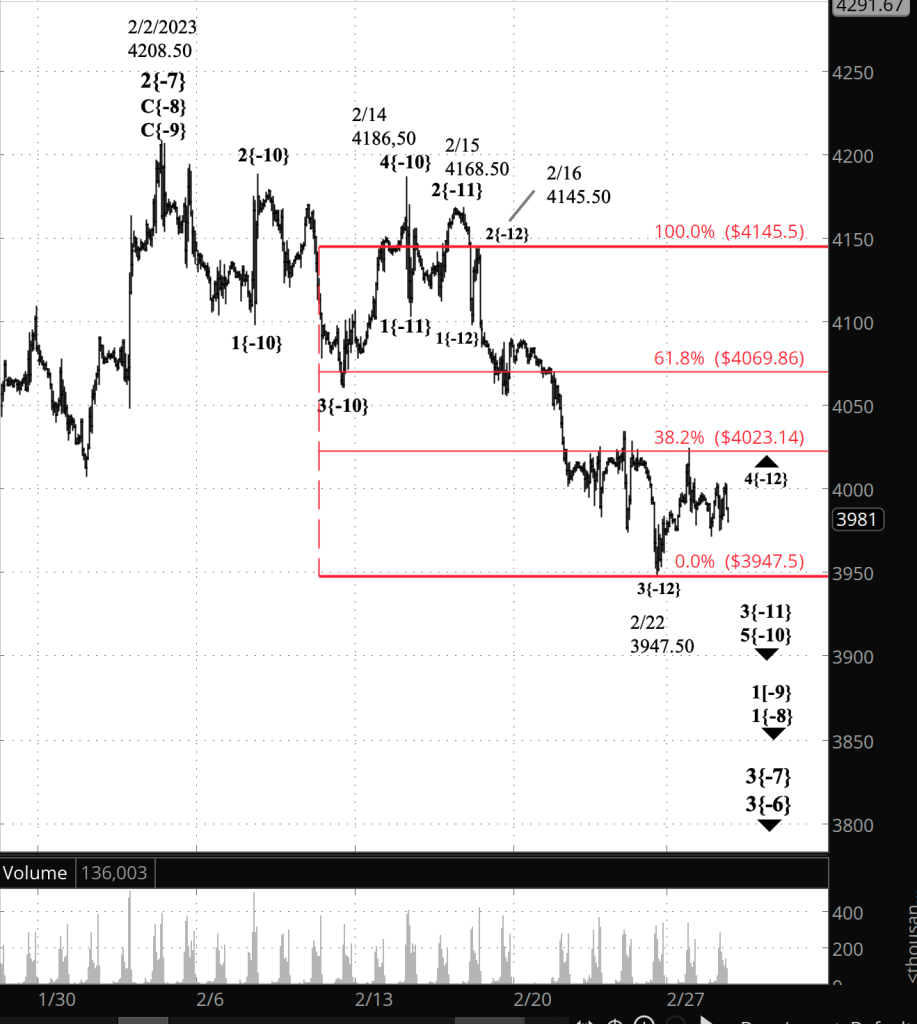
[S&P 500 E-mini futures at 3:30 p.m., hourly bars, with volume]
What does Elliott wave theory say? These are the waves that are guiding my analysis.
Principal analysis:
- The downward correction that began on February 2, wave 3{-7}, continues.
- It is in the first of five subwaves, wave 1{-8}.
- Within wave 1{-8}, wave 1{-9} is underway and is in the final subwave within a five-wave structure, downtrending wave 5{-10}.
- Wave 5{-10}, in turn, is in its middle wave, 3{-11}.
- Wave 3{-11}’s middle wave, wave 3{-12}, ended on February 22, and the next-to-the-last wave, an upward correction, wave 4{-12}, is now underway.
- Internally, wave 4{-12} is in its middle wave of three waves, B{-13}, which reversed downward from the 38.2% Fibonacci retracement level.
- Wave 4{-12} will be followed by wave 5{-12}, which will mark the end of wave 3{-11}, a subwave of downtrending wave 5{-10}.
- When wave 5{-10} is complete, it will also mark the end of wave 1{-9} and the beginning of a low-degree upward correction, wave 2{-9}.
- Wave 3{-7} is still taking its tentative first steps and will develop into a powerful downtrend that will carry the price below 3502, the starting point of the preceding upward correction, wave 2{-7}, and most likely significantly below that level.
Alternative analysis:
The alternative makes these changes to the principal analysis.
- The February 22 low is the end of wave 5{-12} and also the end of its parent wave, 3{-11}.
- Wave 4{-11}, an upward correction, began on that date.
We Are Here.
These are the waves currently in progress under my principal analysis. Each line on the list shows the wave number, with the subscript in curly brackets, the traditional degree name, the starting date, the starting price of the S&P 500 E-mini futures, and the direction of the wave.
- S&P 500 Index:
- 5{+3} Supercycle, 7/8/1932, 4.40 (up)
- 5{+2} Cycle, 12/9/1974, 60.96 (up)
- 5{+1} Primary, 3/6/2009, 666.79 (up)
- 5{0} Intermediate, 12/26/2018, 2346.58 (up)
- S&P 500 Futures and index:
- 4{-1} Minor, 1/4/2022, 4808.25 (down) (futures), 4818.62 (down) (index)
- S&P 500 Futures:
- 1{-2} Minute, 1/4/2022, 4808.25 (down)
- 1{-3} Minuette, 1/4/2022, 4808.25 (down)
- 1{-4} Subminuette, 1/4/2022, 4808.25 (down)
- 1{-5} Micro, 1/4/2022, 4808.25 (down)
- 3{-6} Submicro, 8/16/2022, 4327.50 (down)
- 3{-7} Minuscule, 2/2/2023, 4208.50 (down)
Learning and other resources. Elliott wave analysis provides context, not prophecy. As the 20th century semanticist Alfred Korzybski put it in his book Science and Sanity (1933), “The map is not the territory … The only usefulness of a map depends on similarity of structure between the empirical world and the map.” And I would add, in the ever-changing markets, we can judge that similarity of structure only after the fact.
See the menu page Analytical Methods for a rundown on where to go for information on Elliott wave analysis.
By Tim Bovee, Portland, Oregon, February 28, 2023
Disclaimer
Tim Bovee, Private Trader tracks the analysis and trades of a private trader for his own accounts. Nothing in this blog constitutes a recommendation to buy or sell stocks, options or any other financial instrument. The only purpose of this blog is to provide education and entertainment.
No trader is ever 100 percent successful in his or her trades. Trading in the stock and option markets is risky and uncertain. Each trader must make trading decisions for his or her own account, and take responsibility for the consequences.
License
All content on Tim Bovee, Private Trader by Timothy K. Bovee is licensed under a Creative Commons Attribution-ShareAlike 4.0 International License.
Based on a work at www.timbovee.com.

You must be logged in to post a comment.