3:30 p.m. New York time
Half an hour before the closing bell. The S&P 500 futures moved below the overnight low, confirming that downtrend that began on March 6 is continuing. In Elliott wave terminology, the downtrend is wave 5{-12}. Internally, it is in its initial wave, 1{-13}, and that initial wave is in its final segment, wave 5{-14}. That final segment has a ways to go. Its downtrending middle segment, wave 3{-15}, began from today’s high, 3941.75 and so far has reached in to the 3840s.
This morning’s principal analysis is unchanged. I’ve updated the upper, short-term, chart.
9:35 a.m. New York time
What’s happening now? The S&P 500 E-mini futures fell to an overnight low of 3884.25 and then rose slightly. As the opening bell approached, new employment figures showed an unexpectedly high growth, and the futures responded by fluctuating rapidly between the 3890s and the 3940s within the span of a few minutes before settling back in the 3930s.
What does it mean? Two possibilities of almost equal likelihood. As the principal analysis, I see the downtrend that began on March 9 continuing, with the rise overnight being an upward correction within that downtrend. Here’s my reasoning: The downtrend until the overnight low has had no countertrend waves sufficient to count as a correction, so the rise from the low must be the 2nd degree within the downtrend, and if the downtrend ended at the overnight low, it would have begun and ended on the same day, a timespan a bit short for a 5th wave of this degree, in my opinion.
What are the alternatives? Nonetheless, it’s possible that the downtrend that began on March 9 ended at the overnight low, and the upward movement is the starting point of a larger upward movement, within the downtrend that began on March 6.
If the price reverses soon and drops below 3884.25, that will confirm the principal scenario. If the price continues to rise in five subwaves, followed by two more waves while remaining above 3884.25, that will increase the likelihood of the alternative scenario.
Another big uncertainty at this point is where the smaller waves fit in the large waves.
In any case… It’s important, I think, to keep the bigger picture in mind. All of this is happening within a larger downtrend, a 3rd wave, which began on February 2 from 4208.50. The preceding 1st wave ended October 10 at 3502. That larger downtrend can be expected to carry that price below that level, most likely by a considerable distance.
Ultimately, the smaller movements that are the part of our daily tracking are of little importance compared to the downtrending power of the wave that began on February 2. I normally don’t use Elliott wave nomenclature in this section of my analysis, but for clarity, I’ll make an exception. That powerful downtrend is wave 3{-7} on the chart, what the developer of Elliott Wave Analysis, R.N. Elliott, would have called wave 3 of Minuscule degree. Minuscule, maybe, but of huge importance for investors wanting to avoid the price losses that lie ahead.
Reading the chart. Elliott wave analysis views the chart as a complex structure of smaller waves nested within larger waves, which in turn are nested within still larger waves. My labeling system assigns numbers to the subwaves of trending waves, and letters to the subwaves of corrections. Each number or letter is followed by a subscript, in curly brackets, showing the waves position within the complex structure, called its “degree” in Elliott wave parlance. The smaller the number, the lower the degree. On this chart we’re dealing with relatively small waves, so the degree numbers are negative.
The upper chart, of the S&P 500 futures, shows the peak of the downtrend that began on February 2 and all that has happened since.
The lower chart, of the S&P 500 index, shows the early pandemic crash of February 2020 and all that has happened since. The red lines are the upper and lower boundaries of an expanding Diagonal Triangle that began on December 26, 2018.
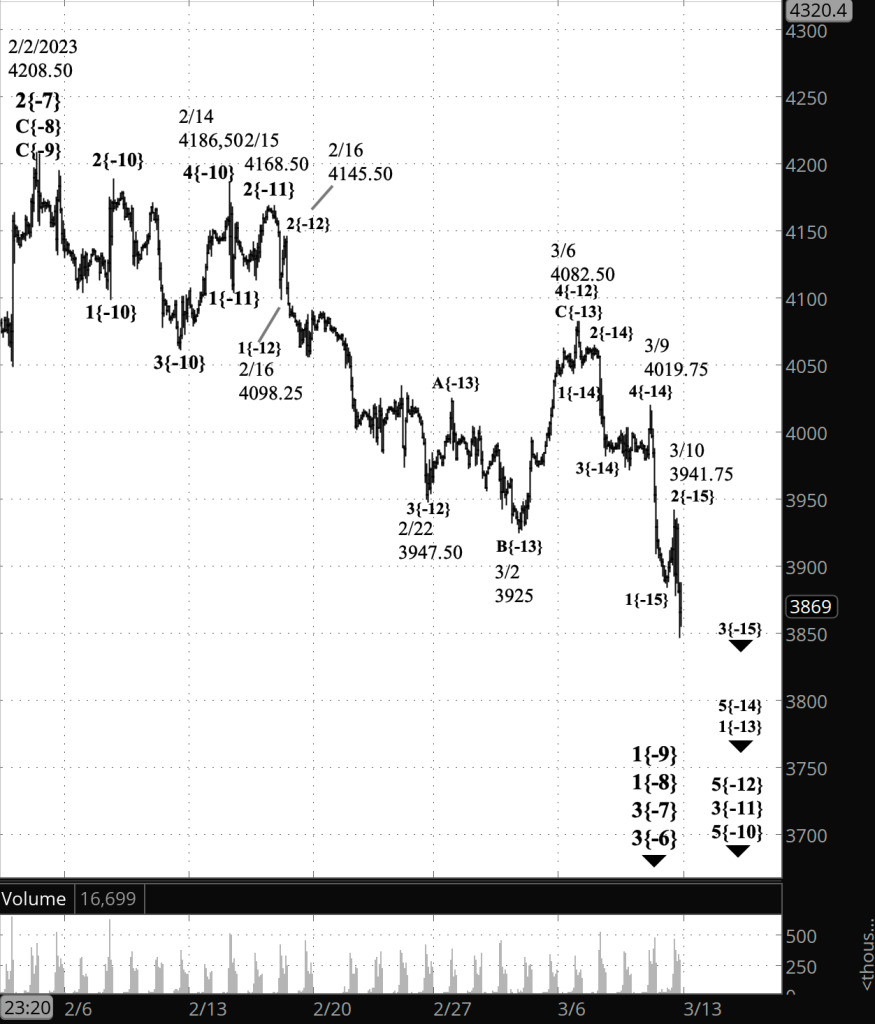
[S&P 500 E-mini futures at 3:30 p.m., 80-minute bars, with volume]
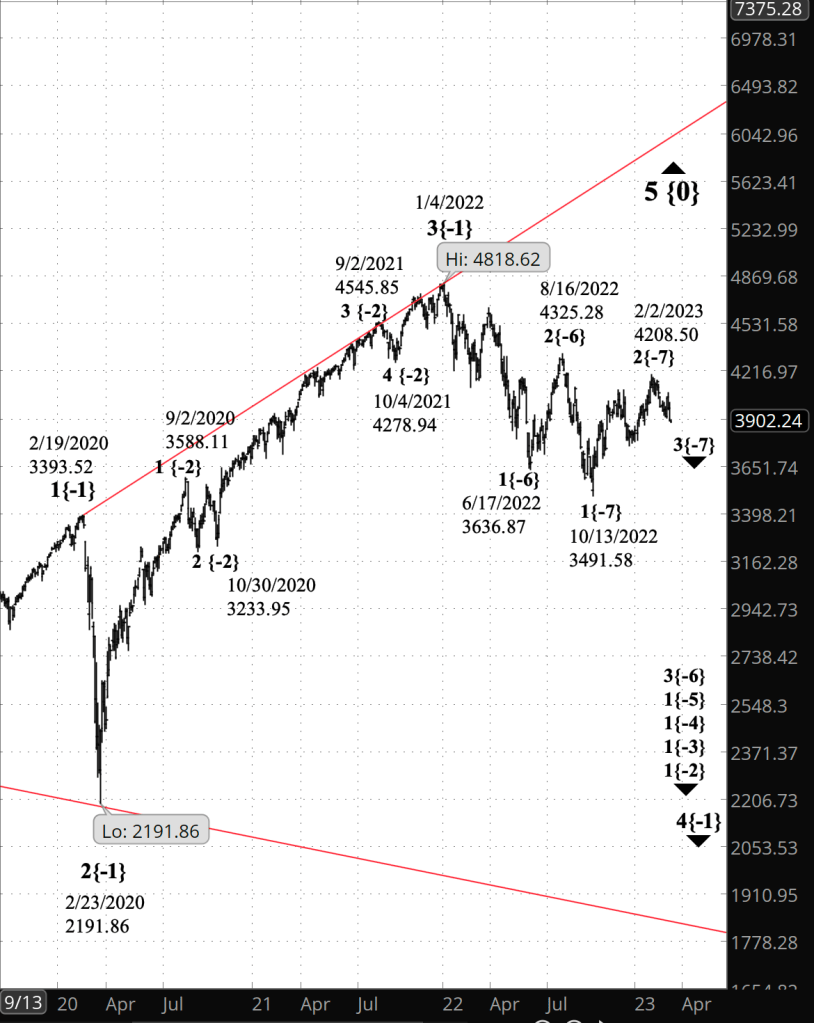
[S&P 500 index at 9:35 a.m., 2-day bars]
What does Elliott wave theory say? These are the Elliott waves that underly the analysis.
Principal analysis:
- The downward correction that began on February 2, wave 3{-7}, continues.
- It is in the first of five subwaves, wave 1{-8}.
- Within wave 1{-8}, wave 1{-9} is underway and is in the final subwave within a five-wave structure, downtrending wave 5{-10}.
- Wave 5{-10}, in turn, is in its middle wave, 3{-11}, which is in its final wave, 5{-12}..
- The end of wave 5{-12} will also be the end of wave 3{-11}, a subwave of downtrending wave 5{-10}.
- When wave 5{-10} is complete, it will also mark the end of wave 1{-9} and the beginning of a low-degree upward correction, wave 2{-9}.
- Within wave 5{-12}, downtrending wave 1{-13} is underway and internally is in wave 5{-14}, its final wave.
- When complete, wave 5{-14} will mark the end of wave 1{-13} and the start of an upward correction, wave 2{-13}.
- Within wave 5{-12} the subwave degrees are uncertain.
- On the chart I’ve posited the current price at wave 5{-14} within wave 1{-13}, which in turn is the first wave within wave 5{-12}.
- However, the {-14} degree could possibly to turn out to be at the {-13} degree. The context created by the passage of time will clarify the degrees.
- Wave 3{-7} is still taking its tentative first steps and will develop into a powerful downtrend that will carry the price below 3502, the starting point of the preceding upward correction, wave 2{-7}, and most likely significantly below that level.
Alternative analysis:
- Wave 5{-14} ended on March 9, the same day it began, also bringing wave 1{-13} to a conclusion.
- An upward correction, wave 2{-13}, is now underway.
- Wave 2{-13} will have three subwaves. The first subwave, wave A{-14}, will most likely contain five waves within it, making the correction a Zigzag, the most common corrective pattern for 2nd waves.
Bigger structures:
- This is all happening within wave 3{-6}, which began on August 16, 2022.
- Wave 3{-6} is encompassed by a series of larger waves, the smaller within the larger, stretching up five degrees to wave 4{-1}, which began on January 4, 2022.
- Wave 4{-1} is the next-to-the-last wave within a large expanding Diagonal Triangle, wave 5{0}, that began on December 26, 2018
- When wave 4{-1} is complete, wave 5{-1} will begin and will carry the wave above the January 4 high, 4808.25, and into the 6000s, where the present upper boundary of the triangle lies. The expanding part means that each day that upper boundary moves higher.
We Are Here.
These are the waves currently in progress under my principal analysis. Each line on the list shows the wave number, with the subscript in curly brackets, the traditional degree name, the starting date, the starting price of the S&P 500 E-mini futures, and the direction of the wave.
- S&P 500 Index:
- 5{+3} Supercycle, 7/8/1932, 4.40 (up)
- 5{+2} Cycle, 12/9/1974, 60.96 (up)
- 5{+1} Primary, 3/6/2009, 666.79 (up)
- 5{0} Intermediate, 12/26/2018, 2346.58 (up)
- S&P 500 Futures and index:
- 4{-1} Minor, 1/4/2022, 4808.25 (down) (futures), 4818.62 (down) (index)
- S&P 500 Futures:
- 1{-2} Minute, 1/4/2022, 4808.25 (down)
- 1{-3} Minuette, 1/4/2022, 4808.25 (down)
- 1{-4} Subminuette, 1/4/2022, 4808.25 (down)
- 1{-5} Micro, 1/4/2022, 4808.25 (down)
- 3{-6} Submicro, 8/16/2022, 4327.50 (down)
- 3{-7} Minuscule, 2/2/2023, 4208.50 (down)
Learning and other resources. Elliott wave analysis provides context, not prophecy. As the 20th century semanticist Alfred Korzybski put it in his book Science and Sanity (1933), “The map is not the territory … The only usefulness of a map depends on similarity of structure between the empirical world and the map.” And I would add, in the ever-changing markets, we can judge that similarity of structure only after the fact.
See the menu page Analytical Methods for a rundown on where to go for information on Elliott wave analysis.
By Tim Bovee, Portland, Oregon, March 10, 2023
Disclaimer
Tim Bovee, Private Trader tracks the analysis and trades of a private trader for his own accounts. Nothing in this blog constitutes a recommendation to buy or sell stocks, options or any other financial instrument. The only purpose of this blog is to provide education and entertainment.
No trader is ever 100 percent successful in his or her trades. Trading in the stock and option markets is risky and uncertain. Each trader must make trading decisions for his or her own account, and take responsibility for the consequences.
License
All content on Tim Bovee, Private Trader by Timothy K. Bovee is licensed under a Creative Commons Attribution-ShareAlike 4.0 International License.
Based on a work at www.timbovee.com.

You must be logged in to post a comment.