3:30 p.m. New York time
Half an hour before the closing bell. The S&P 500 futures rose during the session, lending credence to the upward correction still being underway.
The correction, wave 2{-8}, is near it’s end. It is in its final segment, C{-9}, which is in its final subwave, E{-10} and, one degree down, E{-11}. Within wave E{-11}, subwave E{-12} began from the overnight low, 4150.50. When wave E{-12} is complete, the correction will also be complete and the downtrend, wave 3{-8}, will begin.
Unless, that is, the correction forms a compound structure, linking two or three corrective patterns together. If that alternative proves to be the case, then then the futures and the S&P 500 index will be hanging out near present levels for awhile, perhaps for another month or two.
I’ve updated the chart.
9:35 a.m. New York time
What’s happening now? The S&P 500 E-mini futures fell overnight, to 4150.50.
What does it mean? Did the upward correction that began 36 days ago reach its end on April 18, at 4198.25, giving way to the downtrend that Elliott wave analysis told us would follow? Or is there still a final push to the upside ahead before the upward correction is complete?
Supporting the idea that the correction, the 2nd wave in a larger downtrend, complete is the nearness of the April 18 high to beginning of the previous 1st ave in the downtrend, from 4208.50. Under the Elliott rules, a 2nd wave can’t rise above the start of the 1st wave, so there isn’t much room for further rise. Also, the decline since April 18 has retraced almost 50% of the rise that began on April 6. There might be a bit more to go if the correction is still underway — the 61.8% Fibonacci retracement level is at 4096.50 — so if the price doesn’t reverse soon, if it goes more than a small distance below 4096.50, then the downtrend scenario becomes far more likely.
Supporting the idea that the correction is still underway is the internal count of what the chart shows as wave E{-11}. I count four waves within E{-11}, including the present downtrend, and under the Elliott Wave Principle, it should have five.
I’m leaving the chart mark-up as it has been for a couple of weeks: The upward correction is still underway, is in its final segment, which is in its final subwave. An alternative, that the correction ended on April 18 and that the downtrend has begun, is equally likely. My methodology is, when in doubt, stick with the status quo. I put the burden of proof on the side of change.
What are the alternatives? Complicating things, there is another possible analysis, that the overnight high marked the end of the corrective pattern but not of the correction, which is forming a compound structure, linking two or three corrective patterns together. If that’s the case, then the decline is a downward linking wave, which will be followed by a second corrective pattern.
Reading the chart. I’ve moved the wave closer in to focus on the correction and its end game. See yesterday’s Trader’s Notebook for a broader view that shows the 1st subwave of the downtrend that began on February 2nd as well as the present (or complete) 2nd wave correction that began on March 13. It uses a red arrow to mark the maximum upward movement of the correction under the Elliott rules and a second arrow to mark the correction’s highest point.
Elliott wave analysis views the chart as a complex structure of smaller waves nested within larger waves, which in turn are nested within still larger waves. My labeling system assigns numbers to the subwaves of trending waves, and letters to the subwaves of corrections. Each number or letter is followed by a subscript, in curly brackets, showing the waves position within the complex structure, called its “degree” in Elliott wave parlance. The smaller the number, the lower the degree. On this chart we’re dealing with relatively small waves, so the degree numbers are negative.
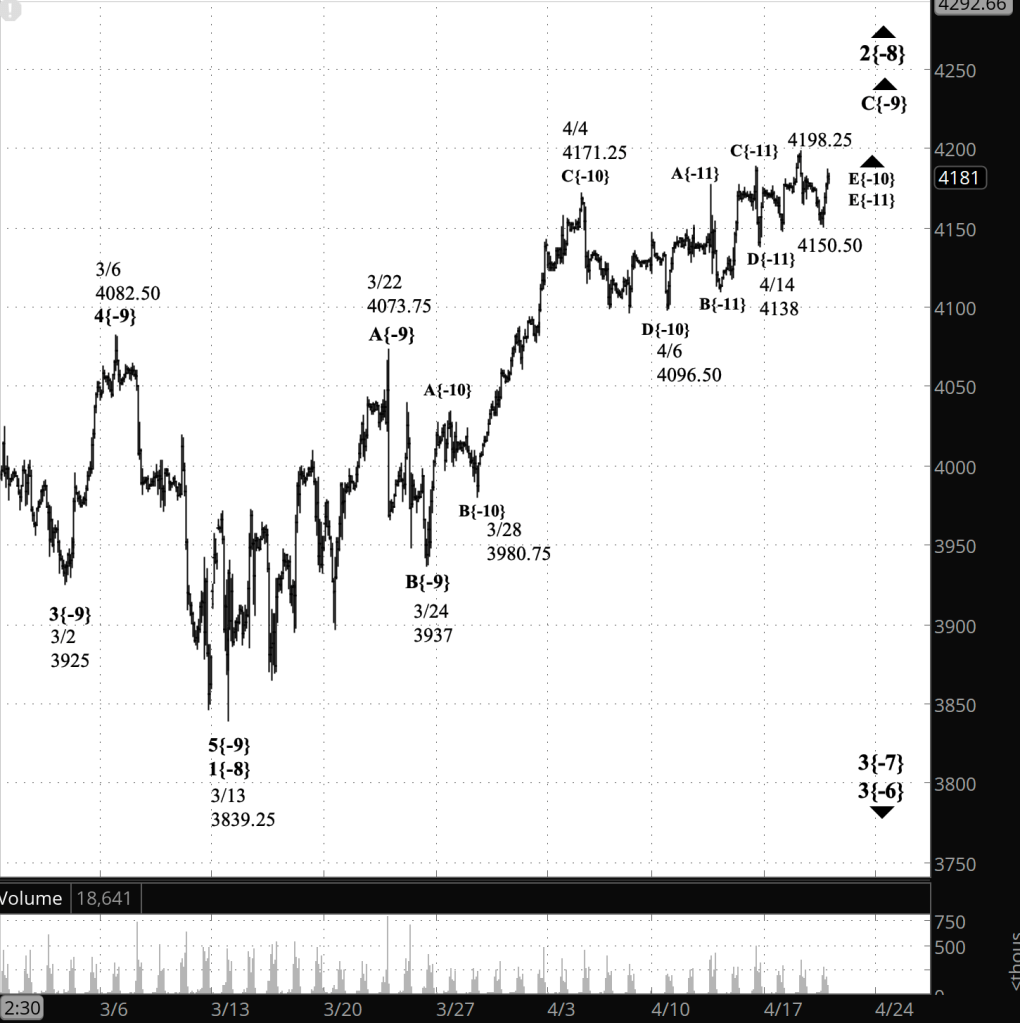
[S&P 500 E-mini futures at 3:30 p.m., 90-minute bars, with volume]
What does Elliott wave theory say? As mentioned above, it’s impossible to choose between two possibilities, so we have two principal analyses.
Principal analysis:
- The upward correction that began on March 13 is wave 2{-8}.
- Within it, wave C{-9}, the correction’s final wave of that degree, is in its final wave, rising wave E{-10}.
- Under a rule of Elliott wave analysis, wave E{-10} cannot move above the starting point of the preceding wave 1{-8}, 4208.50.
Under the principal analysis shown on the chart, concluding that the correction is not complete…
- Wave E{-10} is in its final subwave, E{-11}.
- If wave 2{-8} and its subwaves, C{-9} and E{-10}, move above 4208.50, the starting point of wave 1{-8}, then then analysis will have broken a rule of Elliott wave analysis and a new analysis will be done.
- Wave 2{-8} will be followed by a downtrend, wave 3{-8}, that will carry the price below the correction’s starting point, 3839.25, and most likely significantly below that level.
Under the equally likely principal analysis that concludes that the correction has ended and the downtrend has begun…
- Wave E{-10}, its child, wave E{-11}, and its parent, wave C{-9}, ended at the April 18 peak, bringing the upward correction, wave 2{-8} to an end.
- Downtrending wave 3{-8} is underway.
Alternative analysis #1:
- Wave 2{-8}, the upward correction, is forming a compound structure, linking together two or three corrective patterns.
- Under that alternative, if it should occur, the present rising wave C{-9} will be followed by a declining connector wave, X{-9}, and then the first wave of a second corrective pattern.
- The correction is a 2nd wave, and compounding is seen less often in 2nds. However, they do happen on occasion.
Bigger structures:
- This is all happening within downtrending wave 3{-7}, which began on February 2.
- Wave 3{-7} is a subwave of downtrending wave 3{-6}, which began on August 16, 2022.
- Wave 3{-6} is encompassed by a series of larger declining waves, the smaller within the larger, stretching up five degrees to wave 4{-1}, which began on January 4, 2022.
- Wave 4{-1} is the next-to-the-last wave within a large expanding Diagonal Triangle, wave 5{0}, that began on December 26, 2018
- When wave 4{-1} is complete, wave 5{-1} will begin and will carry the wave above the January 4 high, 4808.25, and back to the upper boundary of the triangle, which gets higher continually and is in the 6090s.
We Are Here.
These are the waves currently in progress under my principal analysis. Each line on the list shows the wave number, with the subscript in curly brackets, the traditional degree name, the starting date, the starting price of the S&P 500 E-mini futures, and the direction of the wave.
- S&P 500 Index:
- 5{+3} Supercycle, 7/8/1932, 4.40 (up)
- 5{+2} Cycle, 12/9/1974, 60.96 (up)
- 5{+1} Primary, 3/6/2009, 666.79 (up)
- 5{0} Intermediate, 12/26/2018, 2346.58 (up)
- S&P 500 Futures and index:
- 4{-1} Minor, 1/4/2022, 4808.25 (down) (futures), 4818.62 (down) (index)
- S&P 500 Futures:
- 1{-2} Minute, 1/4/2022, 4808.25 (down)
- 1{-3} Minuette, 1/4/2022, 4808.25 (down)
- 1{-4} Subminuette, 1/4/2022, 4808.25 (down)
- 1{-5} Micro, 1/4/2022, 4808.25 (down)
- 3{-6} Submicro, 8/16/2022, 4327.50 (down)
- 3{-7} Minuscule, 2/2/2023, 4208.50 (down)
Learning and other resources. Elliott wave analysis provides context, not prophecy. As the 20th century semanticist Alfred Korzybski put it in his book Science and Sanity (1933), “The map is not the territory … The only usefulness of a map depends on similarity of structure between the empirical world and the map.” And I would add, in the ever-changing markets, we can judge that similarity of structure only after the fact.
See the menu page Analytical Methods for a rundown on where to go for information on Elliott wave analysis.
By Tim Bovee, Portland, Oregon, April 19, 2023
Disclaimer
Tim Bovee, Private Trader tracks the analysis and trades of a private trader for his own accounts. Nothing in this blog constitutes a recommendation to buy or sell stocks, options or any other financial instrument. The only purpose of this blog is to provide education and entertainment.
No trader is ever 100 percent successful in his or her trades. Trading in the stock and option markets is risky and uncertain. Each trader must make trading decisions for his or her own account, and take responsibility for the consequences.
License
All content on Tim Bovee, Private Trader by Timothy K. Bovee is licensed under a Creative Commons Attribution-ShareAlike 4.0 International License.
Based on a work at www.timbovee.com.

You must be logged in to post a comment.