3:30 p.m. New York time
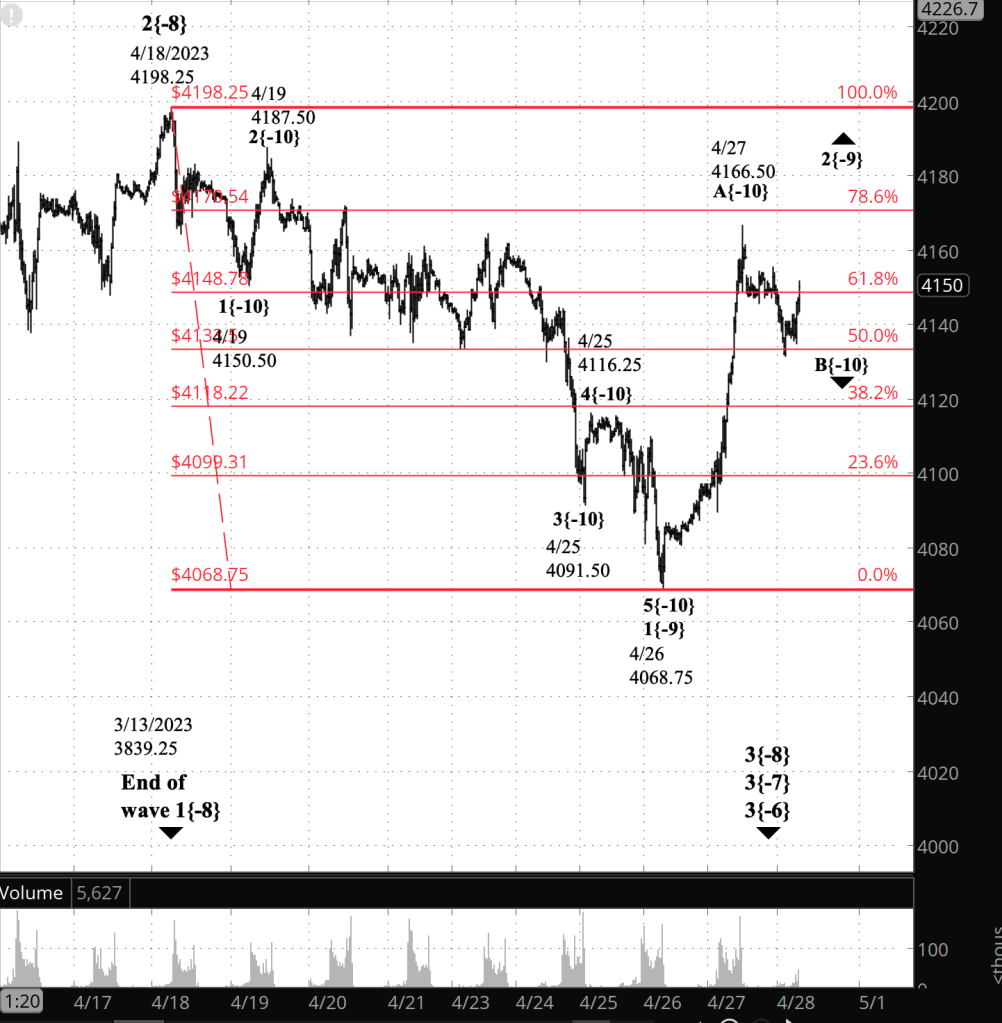
Half an hour before the closing bell. The S&P 500 futures rose during the session to 4186.25 (so far). The decline from yesterday’s peak, discussed in this morning’s post, turned out to be too shallow to count as the second leg of the upward correction, based on the rule of proportionality. So I’m modifying this morning’s analysis to this very tentative analysis: The principal analysis is that first subwave of the correction, wave A{-10}, is still underway. The alternative is that it may have ended at the session high. There are reasons to distrust the alternative scenario, and also reasons to distrust the principal scenario.
It’s at times like these that Elliott wave analysis becomes fun. So let’s parse the possibilities.
I distrust the scenario that says wave A{-10} hasn’t yet ended because, under the rules of Elliott wave analysis, there just isn’t that much upside left. The correction, wave 2{-9}, can’t move above the start of the preceding 1st wave, which was 4198.25. If it does, then it has broken a rule and the analysis will have to be changed. The session high is only 12 points below that limit.
I distrust the alternative scenario that says wave A{-10} ended at today’s peak and wave B{-10} is underway. Today’s larger movements have altered proportionality for the wave to a larger standard. If A{-10} has ended, it had only three internal waves, making the correction a Flat. The tendency for 2nd waves is that they have five subwaves in the A wave, making them Zigzags. The Zigzag tendency isn’t a rule, so it’s possible that wave B{-10} is underway. Nonetheless, the appearance of a Flat 2nd wave is a reason for enhanced caution in the analysis.
For now, I’m marking the chart to show wave A{-10} is still underway, but with low confidence in that analysis.
I’ve retained this morning’s chart for comparison and have added a new chart with this afternoon’s analysis.
[S&P 500 E-mini futures at 3:30 p.m., 25-minute bars, with volume]
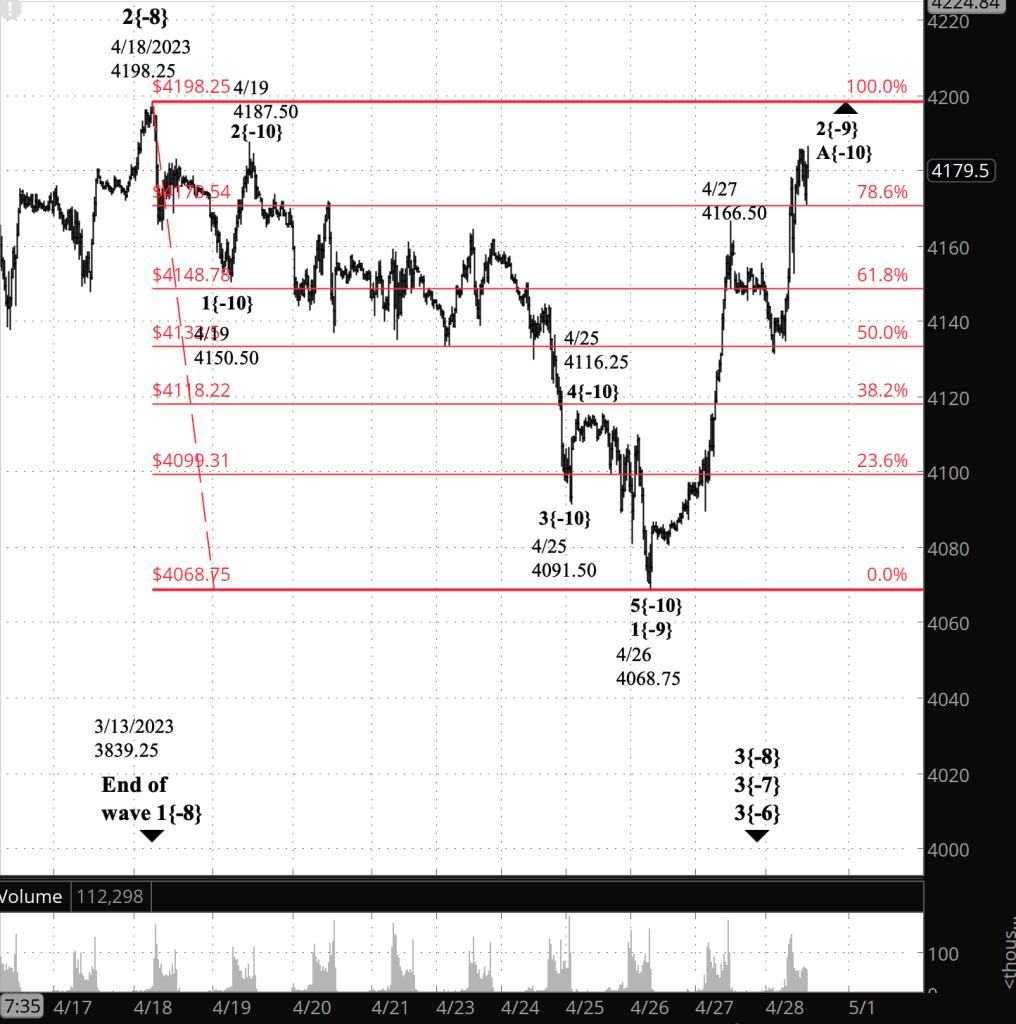
9:35 a.m. New York time
What’s happening now? The S&P 500 E-mini futures peaked shortly after yesterday’s closing bell at 4166.50 and then fell into the 4130s.
What does it mean? The first leg of the upward correction that began on April 26 ended at yesterday’s peak, and the declining second leg is underway. It will be followed by rising third leg that will complete the upward correction.
The peak was 4 points below the 78.6% Fibonacci retracement level. I’ve superimposed the Fibonacci retracement ladder on the chart, in red.
The momentum of the first leg of the correction was so strong that it’s hard to see the details within the wave, but I count five subwaves, meaning that the correction is taking a Zigzag pattern. The correction is a 2nd wave, and the Zigzag pattern is usually how 2nd waves play out.
As a Zigzag, the present downtrend has a restriction under the rules of Elliott wave analysis. It cannot move below the start of the preceding first leg of the correction, which began from 4068.75.
What are the alternatives? None at present. Without a doubt, ambiguities will appear as the correction continues.
[Outdated by new analysis: See above. S&P 500 E-mini futures at 9:35 a.m., 25-minute bars, with volume]
What does Elliott wave theory say? Here are the waves that underly the analysis. [Outdated by this afternoon’s analysis. See above]
Principal analysis:
- The upward correction that began on April 26 is wave 2{-9}.
- It is a subwave of the downtrend that began on April 18, 3{-8}.
- Internally, wave 2{-9} is in wave B{-10}, the middle wave of three in a correction that is taking a Zigzag pattern.
- The first subwave in the correction, wave A{-10}, had five subwaves. Wave B{-10} will have three subwaves, and the future rising wave C{-10} that will complete the correction, five subwaves.
- Wave B{-10}, as part of a Zigzag, will remain above 4068.75, the starting point of its subwave A{-10} and of the correction, wave 2{-9}.
- Wave 2{-9} will be followed by the most energetic part of the downtrend, wave 3{-9}.
- The parent downtrend, wave 3{-8}, will carry the price below the starting point, 3830.25, of wave 2{-8}, the upward correction that began on March 13 and ended on April 18. Most likely the price will decline significantly below that level.
Bigger structures:
- This is all happening within downtrending wave 3{-7}, which began on February 2.
- Wave 3{-7} is a subwave of downtrending wave 3{-6}, which began on August 16, 2022.
- Wave 3{-6} is encompassed by a series of larger declining waves, the smaller within the larger, stretching up five degrees to wave 4{-1}, which began on January 4, 2022.
- Wave 4{-1} is the next-to-the-last wave within a large expanding Diagonal Triangle, wave 5{0}, that began on December 26, 2018
- When wave 4{-1} is complete, wave 5{-1} will begin and will carry the wave above the January 4 high, 4808.25, and back to the upper boundary of the triangle, which gets higher continually and is in the 6090s.
Reading the chart. Elliott wave analysis views the chart as a complex structure of smaller waves nested within larger waves, which in turn are nested within still larger waves. My labeling system assigns numbers to the subwaves of trending waves, and letters to the subwaves of corrections. Each number or letter is followed by a subscript, in curly brackets, showing the waves position within the complex structure, called its “degree” in Elliott wave parlance. The smaller the number, the lower the degree. On this chart we’re dealing with relatively small waves, so the degree numbers are negative.
We Are Here.
These are the waves currently in progress under my principal analysis. Each line on the list shows the wave number, with the subscript in curly brackets, the traditional degree name, the starting date, the starting price of the S&P 500 E-mini futures, and the direction of the wave.
- S&P 500 Index:
- 5{+3} Supercycle, 7/8/1932, 4.40 (up)
- 5{+2} Cycle, 12/9/1974, 60.96 (up)
- 5{+1} Primary, 3/6/2009, 666.79 (up)
- 5{0} Intermediate, 12/26/2018, 2346.58 (up)
- S&P 500 Futures and index:
- 4{-1} Minor, 1/4/2022, 4808.25 (down) (futures), 4818.62 (down) (index)
- S&P 500 Futures:
- 1{-2} Minute, 1/4/2022, 4808.25 (down)
- 1{-3} Minuette, 1/4/2022, 4808.25 (down)
- 1{-4} Subminuette, 1/4/2022, 4808.25 (down)
- 1{-5} Micro, 1/4/2022, 4808.25 (down)
- 3{-6} Submicro, 8/16/2022, 4327.50 (down)
- 3{-7} Minuscule, 2/2/2023, 4208.50 (down)
Learning and other resources. Elliott wave analysis provides context, not prophecy. As the 20th century semanticist Alfred Korzybski put it in his book Science and Sanity (1933), “The map is not the territory … The only usefulness of a map depends on similarity of structure between the empirical world and the map.” And I would add, in the ever-changing markets, we can judge that similarity of structure only after the fact.
See the menu page Analytical Methods for a rundown on where to go for information on Elliott wave analysis.
By Tim Bovee, Portland, Oregon, April 28, 2023
Disclaimer
Tim Bovee, Private Trader tracks the analysis and trades of a private trader for his own accounts. Nothing in this blog constitutes a recommendation to buy or sell stocks, options or any other financial instrument. The only purpose of this blog is to provide education and entertainment.
No trader is ever 100 percent successful in his or her trades. Trading in the stock and option markets is risky and uncertain. Each trader must make trading decisions for his or her own account, and take responsibility for the consequences.
License
All content on Tim Bovee, Private Trader by Timothy K. Bovee is licensed under a Creative Commons Attribution-ShareAlike 4.0 International License.
Based on a work at www.timbovee.com.

You must be logged in to post a comment.