3:30 p.m. New York time
Half an hour before the closing bell. The S&P 500 fluctuated narrowly during the day, ranging from the 4120s to the 4140s. There’s no change in the analysis from this morning. The upward correction continues to work through it’s final patterns before reaching an end. I’ve updated the chart.
9:35 a.m. New York time
What’s happening now? The S&P 500 E-mini futures fell to the 4120s in overnight trading, remaining within Wednesday’s range, from the 4170s to the 4110s.
What does it mean? The upward correction that began on October 13, 2022 is nearing its end, and is working through its final subwaves two degrees smaller. Drop down one degree — the lowest level I’m tracking — and the price is in its declining next-to-the-last subwave.
When that smallest wave, D{-9} on the chart, reaches its end, that finality will cascade up the fractal structure, bringing the correction itself — wave 4{-6} on the chart — to a close.
A downtrend will follow, carrying the price below the correction’s starting point — 3502 — and most likely noticeably lower.
What are the alternatives? If the correction forms a compound structure, then the present corrective pattern won’t complete the correction. Instead, it will be followed by a declining wave and then a second corrective pattern. Compound corrections can be formed from as many as three patterns.
It’s not really an alternative, but in the nearer-term, we’re wading through the ambiguities of which low point marks the end of the downtrending low-degree wave, D{-9}, and the final uptrending wave, E{-9}, that will bring the correction to an end. Identifying turning points means navigating the ambiguity inherent in Elliott wave analysis. So, rule of thumb: Each low since the May 10 peak could be the end of the D{-9}. Or not. Each high could mean the final wave, E{-9}, has begun. Or not.
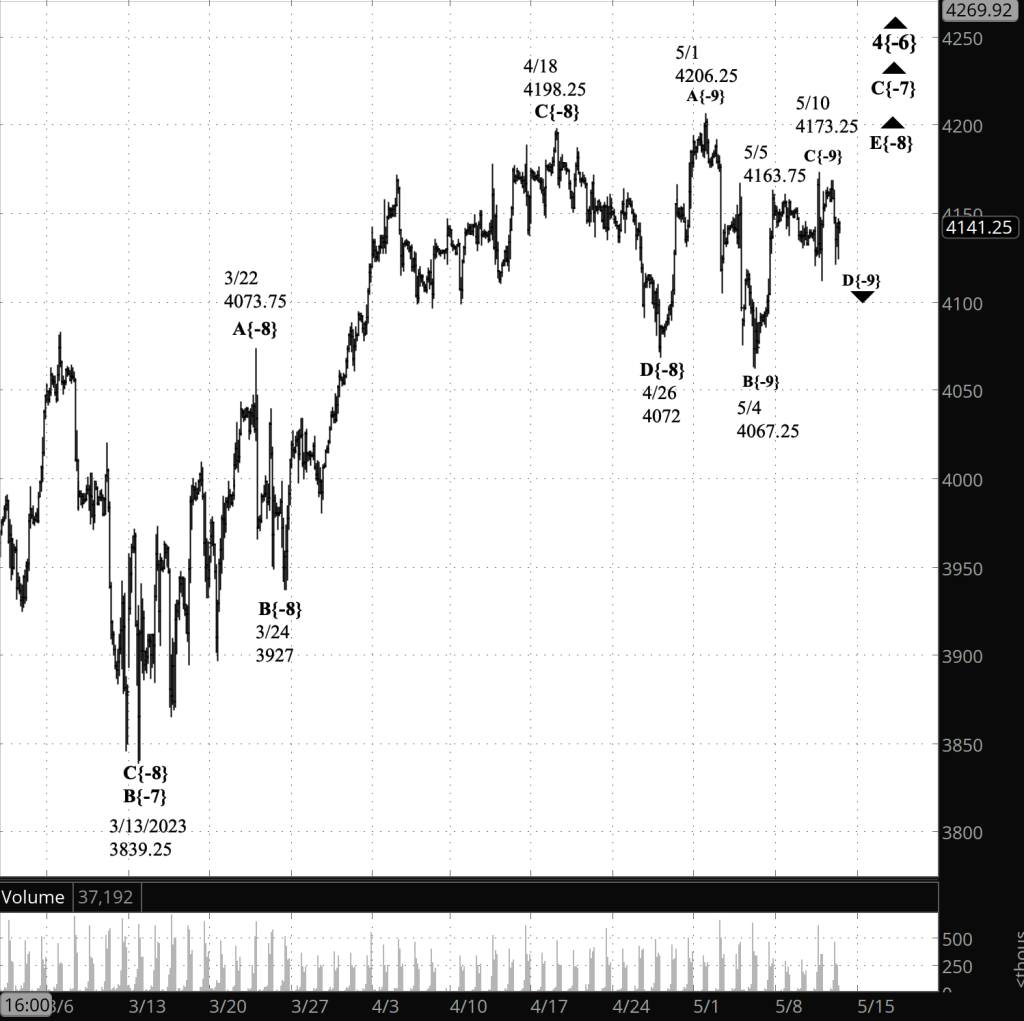
[S&P 500 E-mini futures at 3:30 p.m., 2-hour bars, with volume]
What does Elliott wave theory say? Here are the waves that underly the analyses.
Principal analysis:
- An upward correction, wave 4{-6}, began on October 13, 2022 and is underway.
- The correction’s first subwave, wave A{-7}, had five subwaves, meaning the correction is taking the form of a Zigzag
- Wave 4{-6} is in its final subwave wave, C{-7}, which began on March 13, 2023.
- Wave C{-7} is in its final subwave, wave E{-8}.
- Wave E{-8} is in its next-to-the-last subwave, falling wave D{-9}.
- Wave 4{-6} will be followed by downtrending wave 5{-6}, which, like all 5th waves, might match one of a number of different patterns, all based on the downtrend’s relation with the end of the preceding 3rd wave, at 3502.
- Almost always a 5th wave will move past the preceding 3rd wave’s end point.
- Some 5th waves are truncated, and on this chart that means wave 5{-6} would end before reaching 3502.
- Some 5th waves are extended, that would mean wave 5{-6} would have nine waves internally rather than the usual five, and would cover a greater than expected distance over a greater than expected period of time.
Alternative analysis, compound correction:
- The end of wave C{-7} may won’t be the end of the wave 4{-6} correction.
- Wave 4{-6} will form a compound structure and wave C{-7} ends the first corrective pattern.
- Wave C{-7} will be followed by a declining connector, wave X{-7}, and then by a second corrective pattern.
Alternative analysis, turning points
- At some point, wave D{-9} will end and wave E{-9}, the final wave that will end the upward correction, will begin.
- It won’t be obvious when that happens.
- A move below the prior low point of wave D{-9} will confirm that the wave has been underway, and it may or may not end at that new low.
- A move above the wave C{-9} peak will confirm that wave D{-9} has ended and wave E{-9} has begun.
Bigger structures:
- This is all happening within downtrending wave 1{-5}, which began on January 4, 2022 from 4808.25.
- Wave 1{-5} is a subwave of a nested series of larger subwaves, from wave 1{-4} to wave 1{-2}. which also began on January 4, 2022.
- Wave 1{-2} is a subwave of wave 4{-1}, the next-to-the-last wave within a large expanding Diagonal Triangle, wave 5{0}, that began on December 26, 2018.
- When wave 4{-1} is complete, wave 5{-1} will begin and will carry the wave above the January 4 high.25, and back to the upper boundary of the triangle, which gets higher continually and is in the 6140s.
Reading the chart. Elliott wave analysis views the chart as a complex structure of smaller waves nested within larger waves, which in turn are nested within still larger waves. My labeling system assigns numbers to the subwaves of trending waves, and letters to the subwaves of corrections. Each number or letter is followed by a subscript, in curly brackets, showing the waves position within the complex structure, called its “degree” in Elliott wave parlance. The smaller the number, the lower the degree. On this chart we’re dealing with relatively small waves, so the degree numbers are negative.
We Are Here.
These are the waves currently in progress under my principal analysis. Each line on the list shows the wave number, with the subscript in curly brackets, the traditional degree name, the starting date, the starting price of the S&P 500 E-mini futures, and the direction of the wave.
- S&P 500 Index:
- 5{+3} Supercycle, 7/8/1932, 4.40 (up)
- 5{+2} Cycle, 12/9/1974, 60.96 (up)
- 5{+1} Primary, 3/6/2009, 666.79 (up)
- 5{0} Intermediate, 12/26/2018, 2346.58 (up)
- S&P 500 Futures and index:
- 4{-1} Minor, 1/4/2022, 4808.25 (down) (futures), 4818.62 (down) (index)
- S&P 500 Futures:
- 1{-2} Minute, 1/4/2022, 4808.25 (down)
- 1{-3} Minuette, 1/4/2022, 4808.25 (down)
- 1{-4} Subminuette, 1/4/2022, 4808.25 (down)
- 1{-5} Micro, 1/4/2022, 4808.25 (down)
- 4{-6} Submicro, 10/13/2022, 3502 (up)
- C{-7} Minuscule, 3/13/2023, 3830.25 (up)
Learning and other resources. Elliott wave analysis provides context, not prophecy. As the 20th century semanticist Alfred Korzybski put it in his book Science and Sanity (1933), “The map is not the territory … The only usefulness of a map depends on similarity of structure between the empirical world and the map.” And I would add, in the ever-changing markets, we can judge that similarity of structure only after the fact.
See the menu page Analytical Methods for a rundown on where to go for information on Elliott wave analysis.
By Tim Bovee, Portland, Oregon, May 11, 2023
Disclaimer
Tim Bovee, Private Trader tracks the analysis and trades of a private trader for his own accounts. Nothing in this blog constitutes a recommendation to buy or sell stocks, options or any other financial instrument. The only purpose of this blog is to provide education and entertainment.
No trader is ever 100 percent successful in his or her trades. Trading in the stock and option markets is risky and uncertain. Each trader must make trading decisions for his or her own account, and take responsibility for the consequences.
License
All content on Tim Bovee, Private Trader by Timothy K. Bovee is licensed under a Creative Commons Attribution-ShareAlike 4.0 International License.
Based on a work at www.timbovee.com.

You must be logged in to post a comment.