3:30 p.m. New York time
Half an hour before the closing bell. The S&P 500 futures continued to fluctuate narrowly as it works its way through a triangle, the wave that, when complete, will also be the end of the much larger upward correction that began last October. No change from this morning’s analysis. I’ve updated the chart.
9:35 a.m. New York time
What’s happening now? The S&P 500 E-mini futures continued zigzagging overnight, reaching a low of 4135.25 and then rising to a peak of 4151.50 before pulling back.
What does it mean? In last Friday’s analysis I mentioned the possibility that a triangle was developing. It’s clear now that such is the case. The triangle form can be characteristic of the final wave of a larger movement. If the triangle analysis proves to be correct, then the upward correction that began on October 13, 2022 is in its last leg down three levels of subwaves. The triangle is nearing the 4th of five subwaves.
What are the alternatives? If the correction forms a compound structure, then the present corrective pattern won’t complete the correction. Instead, it will be followed by a declining wave and then a second corrective pattern. Compound corrections can be formed from as many as three patterns.
Reading the chart. On the chart, I’ve marked the triangle structure now underway with red lines.
Price movements — waves – – in Elliott wave analysis are labeled with numbers within trending waves and letters with corrective waves. The subscripts — numbers in curly brackets — designate the wave’s degree, which, in Elliott wave analysis, means the relative position of a wave within the larger and smaller structures that make up the chart. R.N. Elliott, who in the 1930s developed the form of analysis that bears his name, viewed the chart as a complex structure of smaller waves nested within larger waves, which in turn are nested within still larger waves. In mathematics it’s called a fractal structure, where at every scale the pattern is similar to the others.
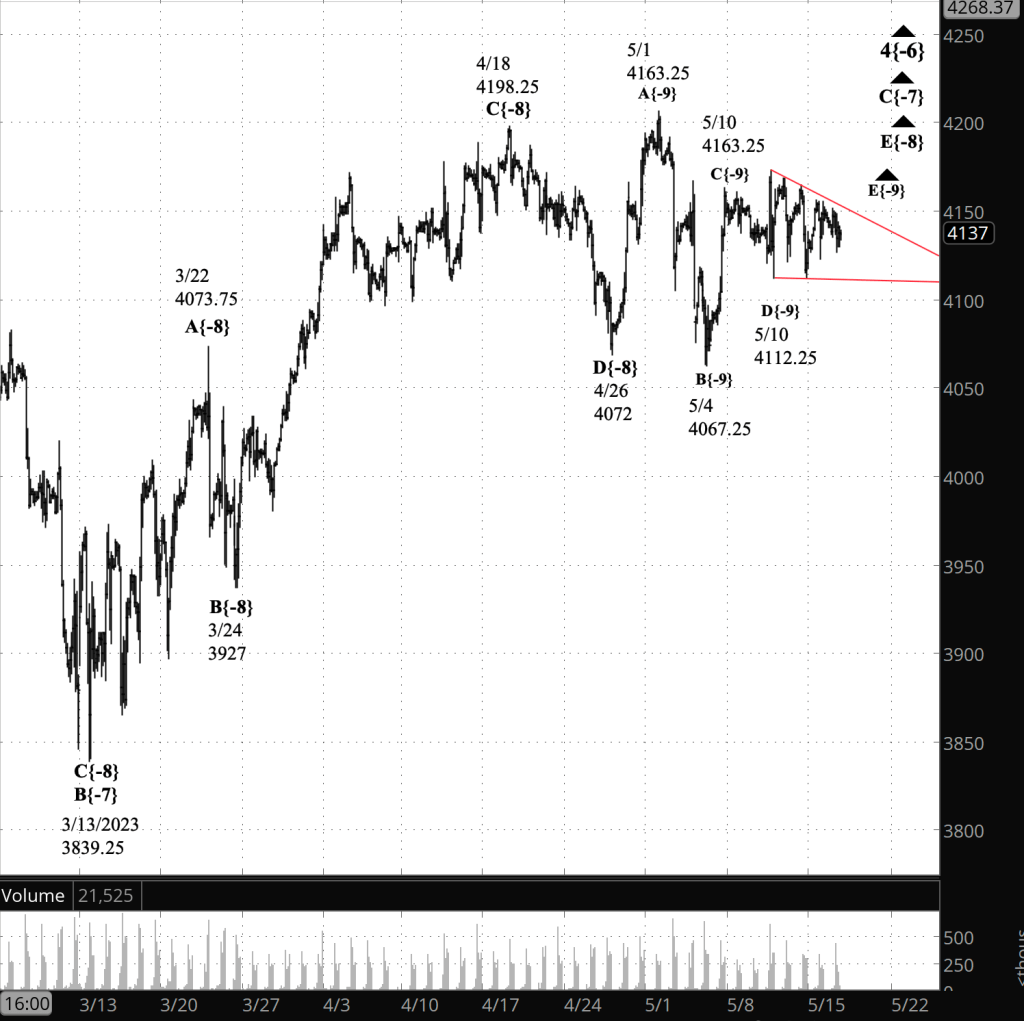
[S&P 500 E-mini futures at 3:30 p.m., 120-minute bars, with volume]
What does Elliott wave theory say? Here are the waves that underly the analyses.
Principal analysis:
- An upward correction, wave 4{-6}, began on October 13, 2022 and is underway.
- The correction’s first subwave, wave A{-7}, had five subwaves, meaning the correction is taking the form of a Zigzag
- Wave 4{-6} is in its final subwave wave, C{-7}, which began on March 13, 2023.
- Wave C{-7} is in its final subwave, wave E{-8}.
- Wave E{-8} is in its final subwave, wave D{-9}, which is taking the form of a triangle.
- Wave 4{-6} will be followed by downtrending wave 5{-6}, which, like all 5th waves, might match one of a number of different patterns, all based on the downtrend’s relation with the end of the preceding 3rd wave, at 3502.
- Almost always a 5th wave will move past the preceding 3rd wave’s end point.
- Some 5th waves are truncated, and on this chart that means wave 5{-6} would end before reaching 3502.
- Some 5th waves are extended, that would mean wave 5{-6} would have nine waves internally rather than the usual five, and would cover a greater than expected distance over a greater than expected period of time.
Alternative analysis, compound correction:
- The end of wave C{-7} may won’t be the end of the wave 4{-6} correction.
- Wave 4{-6} will form a compound structure and wave C{-7} ends the first corrective pattern.
- Wave C{-7} will be followed by a declining connector, wave X{-7}, and then by a second corrective pattern.
We Are Here.
These are the waves currently in progress under my principal analysis. Each line on the list shows the wave number, with the subscript in curly brackets, the traditional degree name, the starting date, the starting price of the S&P 500 E-mini futures, and the direction of the wave.
- S&P 500 Index:
- 5{+3} Supercycle, 7/8/1932, 4.40 (up)
- 5{+2} Cycle, 12/9/1974, 60.96 (up)
- 5{+1} Primary, 3/6/2009, 666.79 (up)
- 5{0} Intermediate, 12/26/2018, 2346.58 (up)
- S&P 500 Futures and index:
- 4{-1} Minor, 1/4/2022, 4808.25 (down) (futures), 4818.62 (down) (index)
- S&P 500 Futures:
- 1{-2} Minute, 1/4/2022, 4808.25 (down)
- 1{-3} Minuette, 1/4/2022, 4808.25 (down)
- 1{-4} Subminuette, 1/4/2022, 4808.25 (down)
- 1{-5} Micro, 1/4/2022, 4808.25 (down)
- 4{-6} Submicro, 10/13/2022, 3502 (up)
- C{-7} Minuscule, 3/13/2023, 3830.25 (up)
Learning and other resources. Elliott wave analysis provides context, not prophecy. As the 20th century semanticist Alfred Korzybski put it in his book Science and Sanity (1933), “The map is not the territory … The only usefulness of a map depends on similarity of structure between the empirical world and the map.” And I would add, in the ever-changing markets, we can judge that similarity of structure only after the fact.
See the menu page Analytical Methods for a rundown on where to go for information on Elliott wave analysis.
By Tim Bovee, Portland, Oregon, May 16, 2023
Disclaimer
Tim Bovee, Private Trader tracks the analysis and trades of a private trader for his own accounts. Nothing in this blog constitutes a recommendation to buy or sell stocks, options or any other financial instrument. The only purpose of this blog is to provide education and entertainment.
No trader is ever 100 percent successful in his or her trades. Trading in the stock and option markets is risky and uncertain. Each trader must make trading decisions for his or her own account, and take responsibility for the consequences.
License
All content on Tim Bovee, Private Trader by Timothy K. Bovee is licensed under a Creative Commons Attribution-ShareAlike 4.0 International License.
Based on a work at www.timbovee.com.

You must be logged in to post a comment.