3:30 p.m. New York time
Half an hour before the closing bell. As the session neared its close, the S&P 500 futures rose back into the 4690s, close to the peak reached by the whipsaw after the latest inflation stats were published.
The final wave within the 2nd-wave upward correction that began on October 13, 2022 continues. This morning’s analysis is unchanged. I’ve updated the chart.
9:35 a.m. New York time
What’s happening now? The S&P 500 E-mini futures moved to a new high, 4696.25, within the present upward correction, as it whipsawed after the Consumer Price Index was published. After peaking, the price rapidly declined into the 4670s.
What does it mean? The 2nd-wave upward correction, which began on October 13, 2023, is in what will likely be its final subwave, wave C. If the correction takes a simple form, wave C will complete the correction, and a large, 3rd-wave downtrend will follow. If it takes a complex form, then the first corrective pattern within wave 2 will bd followed by one or two additional corrective patterns.
Under the rules of Elliott Wave Theory, a 2nd wave cannot move beyond the start of the preceding 1st wave, which in this case was 4953.25. So wave 2 has a lot of potential upside ahead of it. It’s present level is only slightly above the end of the correction’s initial subwave, wave C, at 4634.50.
A C wave is often about the same length as the preceding A wave. In this case, the A wave covered 1143 points. The C wave began from 4122.25. So if this tendency occurs in the present correction, wave C will come close to start of the preceding 1st wave, in the 4950s.
Also, wave A lasted for nine months. Wave C so far has been underway for two months. There will be ups and downs in its journey, but the net direction will be to the upside.
What are the alternatives? Assigning degrees to waves is often a guessing game. The subwaves within the C wave may be a several degrees lower than my labels would have it. They certainly are lower in the fractal structure if wave C lasts as long as the preceding wave A. If wave C moves more rapidly, then the present labeling is correct.
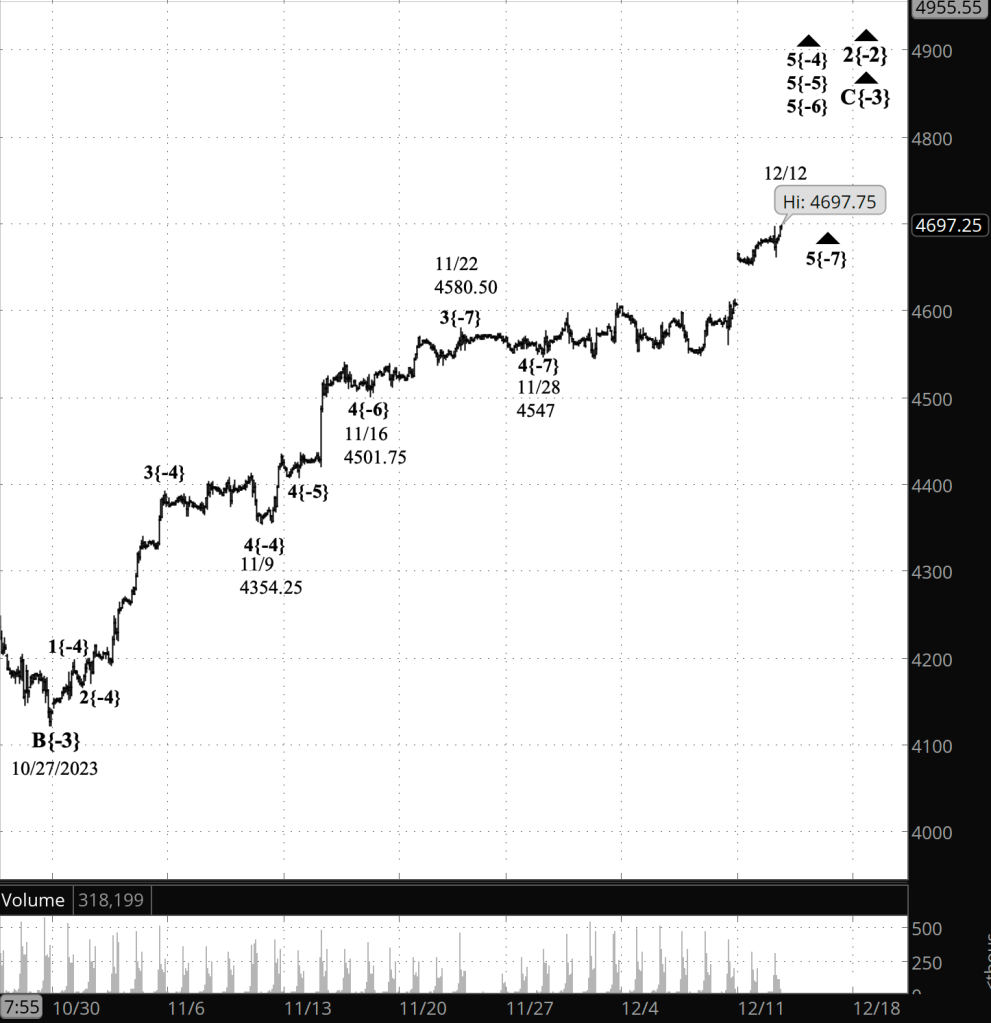
[S&P 500 E-mini futures at 3:30 p.m., 80-minute bars, with volume]
What does Elliott wave theory say? Here are the waves that underly the analyses.
Principal Analysis:
- A downtrend, wave 4{-1}, began on January 4, 2022 and is underway.
- Within wave 4{-1}, an upward correction, wave 2{-2}, began on October 13, 2022.
- The third wave of the correction, wave C{-3}, is underway.
- Wave C{-3} has reached its 5th and final subwave, wave 5{-4} and a series of smaller 5th waves, down to wave 5{-7}.
- When wave 5{-7} is complete, it will cascade up the fractal structure, also ending wave 5{-4} and its parent, wave C{-3} and possibly the upward corection, wave 2{-2}.
We Are Here.
These are the waves currently in progress under my principal analysis. Each line on the list shows the wave number, with the subscript in curly brackets, the traditional degree name, the starting date, the starting price of the S&P 500 E-mini futures, and the direction of the wave.
- S&P 500 Index:
- 5{+3} Supercycle, 7/8/1932, 4.40 (up)
- 5{+2} Cycle, 12/9/1974, 60.96 (up)
- 5{+1} Primary, 3/6/2009, 666.79 (up)
- 5{0} Intermediate, 12/26/2018, 2346.58 (up)
- S&P 500 Futures and index:
- 4{-1} Minor, 1/4/2022, 4953.25 (down) (futures), 4818.62 (down) (index)
- S&P 500 Futures:
- 2{-2} Minute, 10/13/2022, 3491.58 ()
- C{-3} Minuette, 10/27/2023, 4122.25 (up)
Reading the chart. Price movements — waves – – in Elliott wave analysis are labeled with numbers within trending waves and letters with corrective waves. The subscripts — numbers in curly brackets — designate the wave’s degree, which, in Elliott wave analysis, means the relative position of a wave within the larger and smaller structures that make up the chart. R.N. Elliott, who in the 1930s developed the form of analysis that bears his name, viewed the chart as a complex structure of smaller waves nested within larger waves, which in turn are nested within still larger waves. In mathematics it’s called a fractal structure, where at every scale the pattern is similar to the others.
Learning and other resources. Elliott wave analysis provides context, not prophecy. As the 20th century semanticist Alfred Korzybski put it in his book Science and Sanity (1933), “The map is not the territory … The only usefulness of a map depends on similarity of structure between the empirical world and the map.” And I would add, in the ever-changing markets, we can judge that similarity of structure only after the fact.
See the menu page Analytical Methods for a rundown on where to go for information on Elliott wave analysis.
By Tim Bovee, Portland, Oregon, December 12, 2023
Disclaimer
Tim Bovee, Private Trader tracks the analysis and trades of a private trader for his own accounts. Nothing in this blog constitutes a recommendation to buy or sell stocks, options or any other financial instrument. The only purpose of this blog is to provide education and entertainment.
No trader is ever 100 percent successful in his or her trades. Trading in the stock and option markets is risky and uncertain. Each trader must make trading decisions for his or her own account, and take responsibility for the consequences.
License
All content on Tim Bovee, Private Trader by Timothy K. Bovee is licensed under a Creative Commons Attribution-ShareAlike 4.0 International License.
Based on a work at www.timbovee.com.

You must be logged in to post a comment.