5:30 p.m. New York time
After the closing bell. The S&P 500 futures began to fall after it’s overnight high, 5308.50, and continued to fall during the session, gradually picking up speed at first and then plummeting mid-session to a low of 5192.50.
The overnight high proved to be the end of the 5th subwave within the low-degree 4th-wave upward correction that began on April 2, and that means that the 4th wave has ended and the downtrending 5th wave has begun.
The end of the present decline will also be the end of the A wave within a larger 4th-wave downward correction that began on March 31.
The decline has brought the price deep within the likely price target range of the larger 4th wave. Any 4th wave tends to end within the 4th subwave of the preceding 3rd wave. In this case, that gives a price target of 5353.50 down to 5167.75. That’s a tendency, not a firm rule. Some 4th waves are outliers, either ending short of the target or move beyond its boundaries.
The present decline on the chart is labeled wave 5{-7} within wave A{-6}, which is a subwave of wave 4{-5}.
It’s tempting to label the decline from March 31 to April 2 as the three-subwave A{-6}, the subsequent rise as B{-6}, and the session decline as C{-6}, completing wave 4{-5}.
I chose not to label it that way because of a rule in Elliott Wave Theory. Wave 4{-5} is a Flat, with three subwaves in the A wave. The rule says that if a B wave in a Flat fails to retrace last least 90% of wave A, then it’s not really a B wave. In this case, the hypothetical wave B{-7} retraced a fraction less than 74% of hypothetical wave A{-7}. So it’s not a B wave, and in reality,wave A{-6} continues on its downward course.
I’ve updated the chart.
9:40 a.m. New York time
Afternoon wrap. I have a scheduling conflict that will make it impossible for me to post the afternoon analysis, “Half an hour before the closing bell”, on its usual schedule, 3:30 p.m. New York time. I’ll post an analysis when I’m able, sometime after the market close.
9:35 a.m. New York time
What’s happening now? The S&P 500 E-mini futures continued to rise overnight, reaching above 5300.
What does it mean? The rise that began on April 2 has entered its 5th subwave. In Elliott Wave Theory, that means that the low-degree rising 4th-wave correction that began on that day is in its 1st subwave, wave A. A declining B wave, with three subwaves, will follow, and then a rising C wave with five subwaves.
This is all happening within the first subwave of a downward 4th-wave upward correction that began on March 31.
At this point, we’re juggling a lot of nested waves with the fractal structure market, and I’ll bring in the nomenclatre used on the chart: A wave number followed by a subscript curly brackets showing the wave’s relationship to the much larger Intermediate-degree wave that contains everything that has happened over the past few years. The present Intermediate degree wave is wave 5{0}, and it began in December 2018.
A list of the waves referred to earlier in the discussion shows how deeply buried they all are within wave 5{0}. From smaller to larger: Wave A{8} is underway within rising wave 4{-7}, an upward correction within wave A{-6}, the first subwave of a downward correction, wave 4{-5}, that began on March 31.
Wave 4{-5} is part of an uptrending 3rd wave — wave 3{-4} — that began on February 21. When wave 4{-5} is complete, it will be followed by uptrending wave 5[-5}, which will be the final subwave within wave 3{-4}.
That will trigger a larger 4th-wave downward correction than the one’s in progress today. Wave 3[-4} began from 4959. A 4th wave tends to end within the 4th subwave of the preceding 3rd wave of the same degree. That 4th subwave, wave 4{-5}, is still underway. It began March 31 from 5333.50, and that is the upper boundary of the wave 4{-4} target range.
What are the alternatives? Unchanged from the prior post. I’ve numbered the correction as though the A wave is a subwave one degree lower than the parent 4th-wave correction. But is it really? Could it be two degrees lower, making it a subwave of the A wave? Only time will resolve the ambiguity.
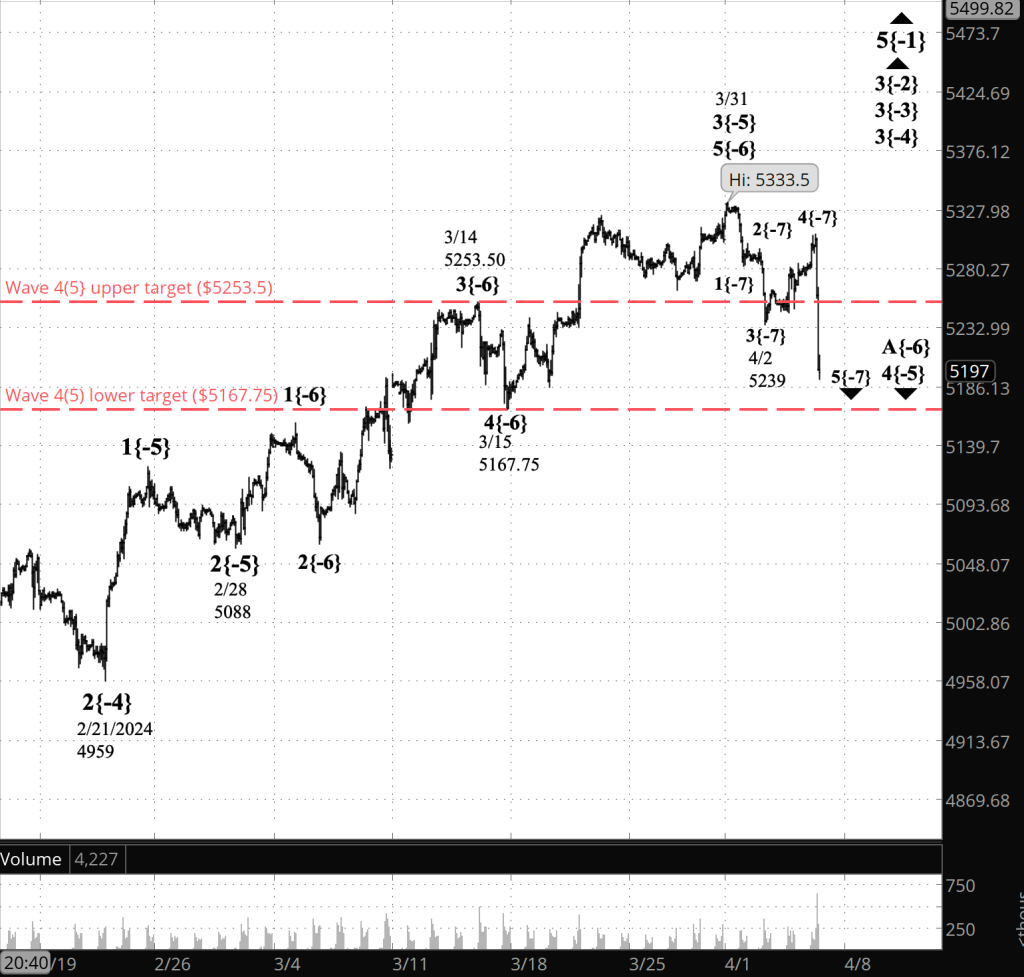
[S&P 500 E-mini futures at 5:35 p.m., 80-minute bars, with volume]
What does Elliott wave theory say? Here are the waves that underly the analyses.
Principal Analysis:
- Rising wave 5{0} is underway.
- It is in its final subwave, wave 5{-1}
- Within wave 5{-1}, rising waves 3{-2}, 3{-3} and 3{-4} are underway, as is the smallest wave labeled on the chart, wave 3{-5}.
- Downtrending wave 4{-5} is in its 1st subwave, wave A{-6}, which in turn is in its next-to-the-last subwave, wave 4{-7}.
- The first subwave of wave 4{-7} — wave A{-8} — is underway.
Reading the chart. Price movements — waves – – in Elliott wave analysis are labeled with numbers within trending waves and letters with corrective waves. The subscripts — numbers in curly brackets — designate the wave’s degree, which, in Elliott wave analysis, means the relative position of a wave within the larger and smaller structures that make up the chart. R.N. Elliott, who in the 1930s developed the form of analysis that bears his name, viewed the chart as a complex structure of smaller waves nested within larger waves, which in turn are nested within still larger waves. In mathematics it’s called a fractal structure, where at every scale the pattern is similar to the others.
Learning and other resources. Elliott wave analysis provides context, not prophecy. As the 20th century semanticist Alfred Korzybski put it in his book Science and Sanity (1933), “The map is not the territory … The only usefulness of a map depends on similarity of structure between the empirical world and the map.” And I would add, in the ever-changing markets, we can judge that similarity of structure only after the fact.
See the menu page Analytical Methods for a rundown on where to go for information on Elliott wave analysis.
By Tim Bovee, Portland, Oregon, April 4, 2024
Disclaimer
Tim Bovee, Private Trader tracks the analysis and trades of a private trader for his own accounts. Nothing in this blog constitutes a recommendation to buy or sell stocks, options or any other financial instrument. The only purpose of this blog is to provide education and entertainment.
No trader is ever 100 percent successful in his or her trades. Trading in the stock and option markets is risky and uncertain. Each trader must make trading decisions for his or her own account, and take responsibility for the consequences.
License
All content on Tim Bovee, Private Trader by Timothy K. Bovee is licensed under a Creative Commons Attribution-ShareAlike 4.0 International License.
Based on a work at www.timbovee.com.

You must be logged in to post a comment.