3:30 p.m. New York time
Half an hour before the closing bell. The S&P 500 futures have risen during the session, to 5308.50 so far.
Application of Elliott Wave Theory suggests that the rise is a low-degree B wave that began on April 4 from 5191.50. That was the endpoint of the preceding declining A wave that began on March 31 from 5333.50. Both waves are subwaves of a 4th wave downward correction that began concurrently with the A wave.
On the chart, the wave’s under discussion are waves A{-6} and B{-6} within wave 4{-5}.
The A wave had five subwaves, identifying the correction as following the Zigzag pattern. A ZigZag B wave typically retraces 38% to 79% of the preceding A wave. Those tendencies would give a target price range for wave B of 5245 to 5303. Note that that range is a tendency, not rule, and the reality on the chart may well differ
I’ve updated the chart.
9:35 a.m. New York time
What’s happening now? The S&P 500 E-mini futures rose gradually overnight, to a high of almost 5220 until the Employment Situation Report was published an hour before the opening bell. The price then whipsawed dramatically, from the 5210s down to the 5190s in the span of a minute, returning within five minutes to the level from which it had begun.
What does it mean? In Elliott Wave Theory, the decline that began on April 4 from 5308.50 is in its 4th subwave and will end with its final subwave, declining wave 5.
The end of the 5th subwave will also be the end of its parent, a larger wave 5, and its grandparent, the first subwave, an A wave, within the 4th wave downward correction that began on March 31 from 5333.50.
In the nomenclature used on the chart, each wave number is followed by a subscript curly brackets showing the wave’s relationship to the much larger Intermediate-degree wave that contains everything that has happened over the past few years. The present Intermediate degree wave is wave 5{0}, and it began in December 2018.
On the chart, the S&P 500 futures are in wave 4{-8} within wave 5{-7} within wave 4{-5} within wave A{-6} within the downward correction, wave 4{-5}.
What are the alternatives?
It’s possible that the small 4th wave within the the decline will turn out to be a 2nd wave. The 1st wave of the decline had such power that the internal reversals aren’t entirely clear.
Also, I’ve numbered the correction as though the A wave is a subwave one degree lower than the parent 4th-wave correction. But is it really? Could it be two degrees lower, making it a subwave of the A wave? Only time will resolve the ambiguity.
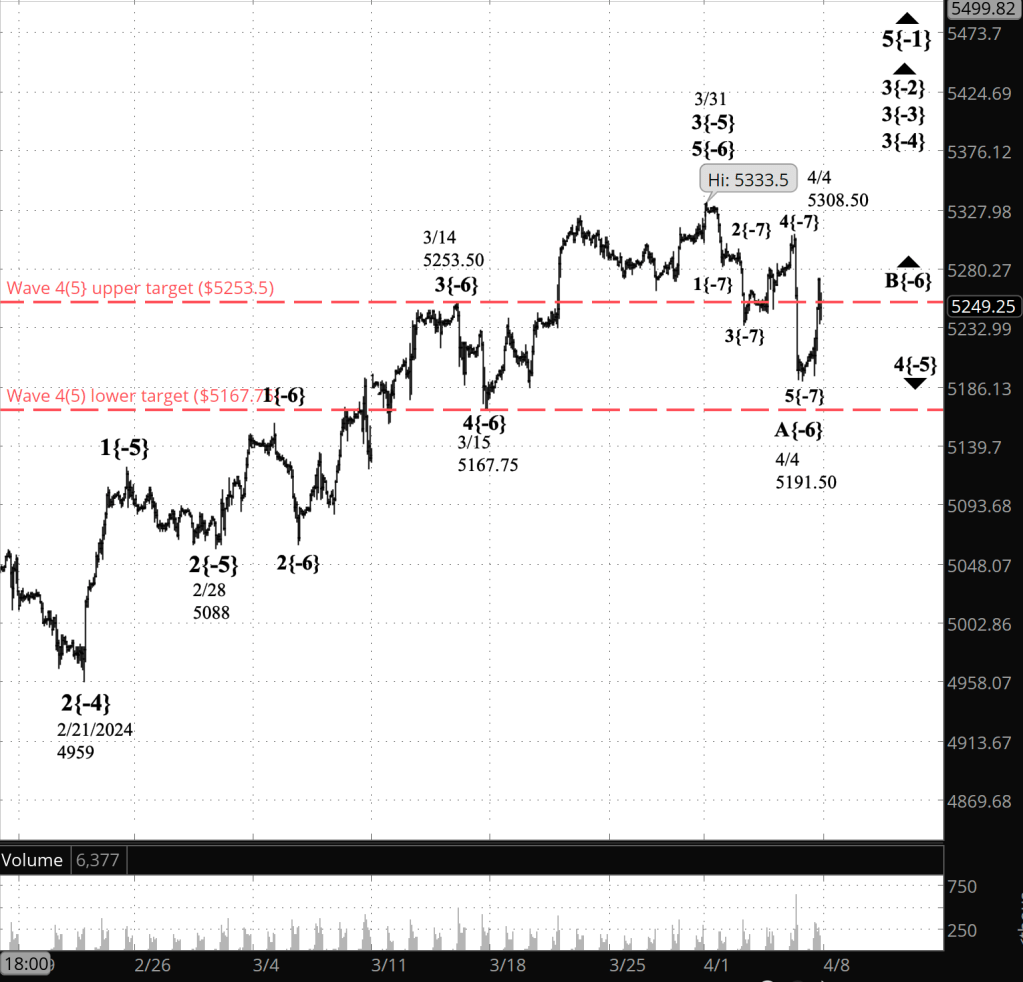
[S&P 500 E-mini futures at 3:30 p.m., 80-minute bars, with volume]
What does Elliott wave theory say? Here are the waves that underly the analyses.
Principal Analysis:
- Rising wave 5{0} is underway.
- It is in its final subwave, wave 5{-1}
- Within wave 5{-1}, rising waves 3{-2}, 3{-3} and 3{-4} are underway, as is the smallest wave labeled on the chart, wave 3{-5}.
- Downtrending wave 4{-5} is in its 1st subwave, wave A{-6}, which in turn is in its last subwave, wave 5{-7}, which is in its next-to-the-last subwave, wave 4{-8}.
Reading the chart. Price movements — waves – – in Elliott wave analysis are labeled with numbers within trending waves and letters with corrective waves. The subscripts — numbers in curly brackets — designate the wave’s degree, which, in Elliott wave analysis, means the relative position of a wave within the larger and smaller structures that make up the chart. R.N. Elliott, who in the 1930s developed the form of analysis that bears his name, viewed the chart as a complex structure of smaller waves nested within larger waves, which in turn are nested within still larger waves. In mathematics it’s called a fractal structure, where at every scale the pattern is similar to the others.
Learning and other resources. Elliott wave analysis provides context, not prophecy. As the 20th century semanticist Alfred Korzybski put it in his book Science and Sanity (1933), “The map is not the territory … The only usefulness of a map depends on similarity of structure between the empirical world and the map.” And I would add, in the ever-changing markets, we can judge that similarity of structure only after the fact.
See the menu page Analytical Methods for a rundown on where to go for information on Elliott wave analysis.
By Tim Bovee, Portland, Oregon, April 5, 2024
Disclaimer
Tim Bovee, Private Trader tracks the analysis and trades of a private trader for his own accounts. Nothing in this blog constitutes a recommendation to buy or sell stocks, options or any other financial instrument. The only purpose of this blog is to provide education and entertainment.
No trader is ever 100 percent successful in his or her trades. Trading in the stock and option markets is risky and uncertain. Each trader must make trading decisions for his or her own account, and take responsibility for the consequences.
License
All content on Tim Bovee, Private Trader by Timothy K. Bovee is licensed under a Creative Commons Attribution-ShareAlike 4.0 International License.
Based on a work at www.timbovee.com.

You must be logged in to post a comment.