3:30 p.m. New York time
Half an hour before the closing bell. The S&P 500 futures fell slightly during the session, reaching into the 5030s. The lower low, in Elliott Wave Theory, confirms that the declining 5th wave that began on April 15 is still underway. The wave is labled wave 5{-7} on the chart, which I’ve updated.
9:35 a.m. New York time
What’s happening now? The S&P 500 E-mini futures meandered sideways overnight, between the 5060s and the 5080s.
What does it mean? Elliott Wave Theory: The final subwave of a 4th-wave downward correction that began on March 31 is close to its end. Wave 4 will be followed by a 5th-wave uptrend that is likely to last for a few weeks, although it could be much swifter or take much longer than that.
Here are the waves now underway, as they are labeled on the chart, with the wave number followed by a subscript in curly brackets that denotes the wave’s distance from the Intermediate degree within the fractal structure of the chart.
Smaller to larger: Declining wave 5{-8}, the final subwave within falling wave 5{-7}, the final subwave within falling wave C{-6}, the final subwave within the downward correction, wave 4{-5}. There’s quite a bit of finality at this moment in the chart.
Of course, the waves underway continue higher. The above waves are all encompassed by a series of rising waves, wave 3{-4}, the middle subwave of wave 3{-3}, which in turn is the middle subwave of wave 3{-2}, the middle subwave of wave 5{-1}, which in turn is the final subwave within wave 5{0}, the Intermediate wave that began in December 2018.
So yes, there’s finality in the smaller corners of the fractal structure, but at the larger end of things, there is quite a bit of upside that will carry us forward beyond the end of 2024 and perhaps much further.
But back to the details. The correction — wave 4{-5} — has taken the from of a Flat, with three subwaves within the A wave. Within that pattern, the C wave tends to retrace somewhere between 100% and 169% of the preceding A wave of the same degree. I’ve marked that range on the chart, keeping in mind that those retracement boundaries represent a tendency, not a firm rule. The price is presently close to the lower boundary of that range.
What are the alternatives? The S&P 500 futures are bottom fishing, which means that any low can be interpreted as being the end of the decline. My principal analysis, described above, concludes that wave 5[-8} is still underway and is in its final subwave, wave 5{-9}. An alternative interpretation sees wave 4{-9} as underway, the next-to-the-last subwave within wave 5{-8}. As always with Elliott Wave Theory, there are ambiguities. At that small degree, they have little significance.
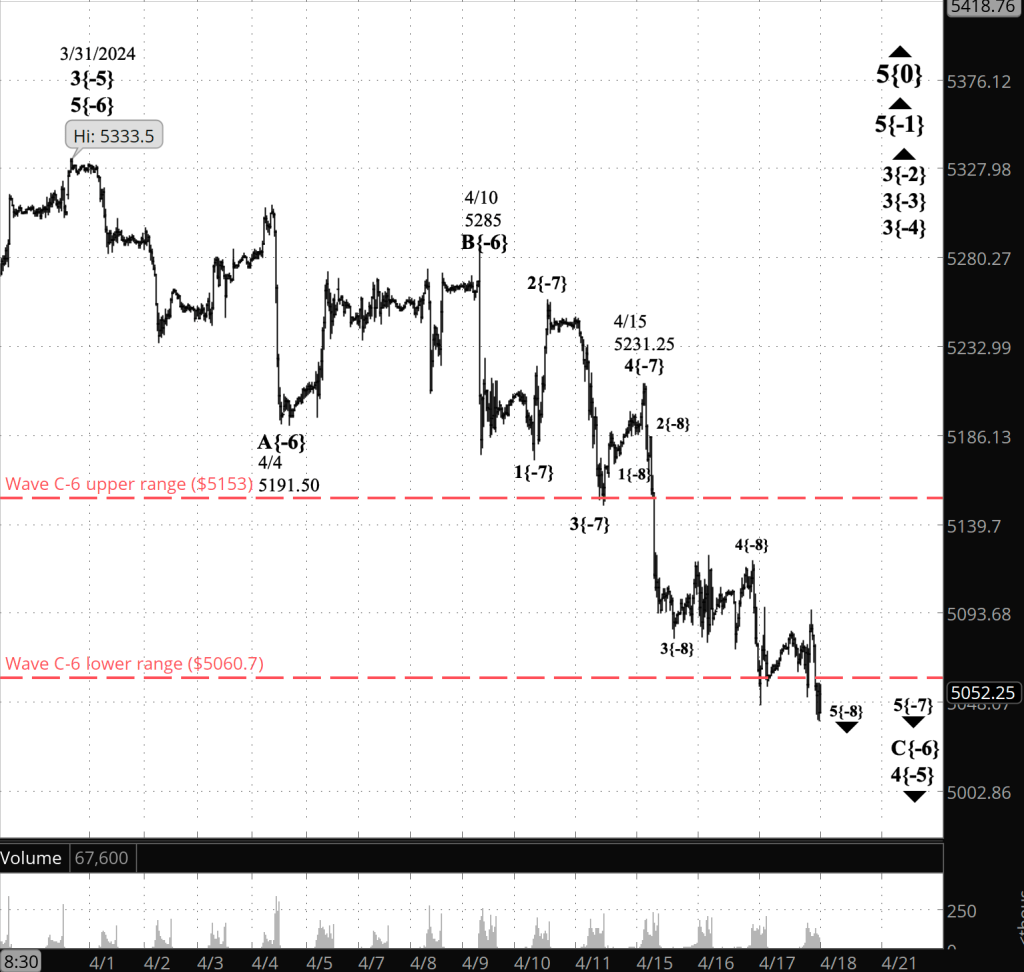
[S&P 500 E-mini futures at 3:30 p.m., 35-minute bars, with volume]
Reading the chart. Price movements — waves – – in Elliott wave analysis are labeled with numbers within trending waves and letters with corrective waves. The subscripts — numbers in curly brackets — designate the wave’s degree, which, in Elliott wave analysis, means the relative position of a wave within the larger and smaller structures that make up the chart. R.N. Elliott, who in the 1930s developed the form of analysis that bears his name, viewed the chart as a complex structure of smaller waves nested within larger waves, which in turn are nested within still larger waves. In mathematics it’s called a fractal structure, where at every scale the pattern is similar to the others.
Learning and other resources. Elliott wave analysis provides context, not prophecy. As the 20th century semanticist Alfred Korzybski put it in his book Science and Sanity (1933), “The map is not the territory … The only usefulness of a map depends on similarity of structure between the empirical world and the map.” And I would add, in the ever-changing markets, we can judge that similarity of structure only after the fact.
See the menu page Analytical Methods for a rundown on where to go for information on Elliott wave analysis.
By Tim Bovee, Portland, Oregon, April 18, 2024
Disclaimer
Tim Bovee, Private Trader tracks the analysis and trades of a private trader for his own accounts. Nothing in this blog constitutes a recommendation to buy or sell stocks, options or any other financial instrument. The only purpose of this blog is to provide education and entertainment.
No trader is ever 100 percent successful in his or her trades. Trading in the stock and option markets is risky and uncertain. Each trader must make trading decisions for his or her own account, and take responsibility for the consequences.
License
All content on Tim Bovee, Private Trader by Timothy K. Bovee is licensed under a Creative Commons Attribution-ShareAlike 4.0 International License.
Based on a work at www.timbovee.com.

You must be logged in to post a comment.